MindMap Gallery Top 10 algorithms in artificial intelligence
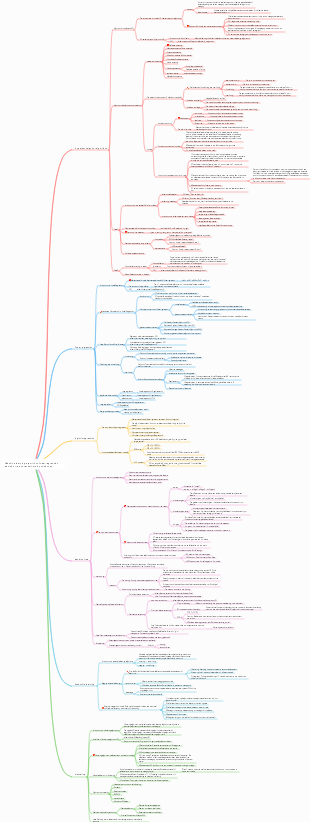
For many people, artificial intelligence is still a relatively "advanced" technology, but no matter how advanced the technology is, it starts from basic principles. There are 10 major algorithms circulating in the field of artificial intelligence. Their principles are simple and they have been discovered and applied very early. You may even have learned them in middle school, and they are very common in life. This article takes you through these 10 algorithms in layman’s terms
Edited at 2023-05-29 19:40:10This is a panoramic infographic—currently sweeping across the web—illustrating the comprehensive applications of OpenClaw, a popular open-source AI agent platform. It systematically introduces this intelligent agent framework—affectionately dubbed "Lobster Farming"—helping readers quickly grasp its core value, technical features, application scenarios, and security protocols. It serves as an excellent introductory guide and practical manual.
這是一張最近風靡全網關於熱門開源AI代理平台OpenClaw的全網應用全景圖解。它系統性地介紹了這款被稱為「養龍蝦」的智慧體框架,幫助讀者快速理解其核心價值、技術特性、應用場景及安全規範,是一份極佳的入門指南與實操手冊。此圖主要針對希望利用AI建構自動化工作流程的技術從業人員、中小企業主及效率追求者,透過9大模組層層遞進,全面剖析了OpenClaw從概念到落地的整個過程。 圖中核心內容首先釐清了「養龍蝦」指涉的是OpenClawd開源智能體,並強調其本質是「AI基建」而非一般聊天機器人。隨後詳細比較其與傳統AI助理的區別,擁有記憶管理、權限控制、會話隔離和異常恢復四大基礎能力,支援跨平台存取和多模型相容(如GPT、Claude、Ollama)。同時,圖解提供了完整的部署方案(雲端/本地/Docker),並列舉了辦公室自動化、內容創作、資料收集等五大應用程式場景。此外,還展示了其火爆程度、政府與大廠佈局、安全部署建議及適合/不適合的人群分類。幫助你快速掌握OpenClaw技術架構與應用價值,指導個人或企業建構AI自動化系統,規避資料外洩與權限失控風險,是學習「執行式AI」轉型的權威參考圖譜。
本圖由萬興腦圖繪製,是針對IT研發崗位的結構化個人履歷模板,完整涵蓋求職核心資訊模組。基本資訊區包含姓名、電話、信箱、求職意願及GitHub連結;專業概要要求以2-3句提煉核心優勢;工作經驗以「公司A高級Java開發工程師」為例,以「透過(行動),達成(量化成果)」格式呈現微服務架構設計、系統效能優化、團隊技術規範制定等職責,公司B經歷則聚焦功能模組開發與Elasticsearch搜尋優化;技能專長分程式語言、後端框架、中介軟體、資料庫、容器雲等維度,清楚展示技術堆疊;專案成果以「電商平台秒殺系統」為例,說明技術棧、架構設計、個人貢獻(Redis Lua庫存原子扣減)及KPI;教育背景包含一流大學電腦專業學歷,以及AWS認證解決方案架構師、軟考中級軟體設計師證書。模板邏輯嚴謹,涵蓋IT研發求職全流程關鍵訊息,幫助求職者清晰、量化展示專業能力。
This is a panoramic infographic—currently sweeping across the web—illustrating the comprehensive applications of OpenClaw, a popular open-source AI agent platform. It systematically introduces this intelligent agent framework—affectionately dubbed "Lobster Farming"—helping readers quickly grasp its core value, technical features, application scenarios, and security protocols. It serves as an excellent introductory guide and practical manual.
這是一張最近風靡全網關於熱門開源AI代理平台OpenClaw的全網應用全景圖解。它系統性地介紹了這款被稱為「養龍蝦」的智慧體框架,幫助讀者快速理解其核心價值、技術特性、應用場景及安全規範,是一份極佳的入門指南與實操手冊。此圖主要針對希望利用AI建構自動化工作流程的技術從業人員、中小企業主及效率追求者,透過9大模組層層遞進,全面剖析了OpenClaw從概念到落地的整個過程。 圖中核心內容首先釐清了「養龍蝦」指涉的是OpenClawd開源智能體,並強調其本質是「AI基建」而非一般聊天機器人。隨後詳細比較其與傳統AI助理的區別,擁有記憶管理、權限控制、會話隔離和異常恢復四大基礎能力,支援跨平台存取和多模型相容(如GPT、Claude、Ollama)。同時,圖解提供了完整的部署方案(雲端/本地/Docker),並列舉了辦公室自動化、內容創作、資料收集等五大應用程式場景。此外,還展示了其火爆程度、政府與大廠佈局、安全部署建議及適合/不適合的人群分類。幫助你快速掌握OpenClaw技術架構與應用價值,指導個人或企業建構AI自動化系統,規避資料外洩與權限失控風險,是學習「執行式AI」轉型的權威參考圖譜。
本圖由萬興腦圖繪製,是針對IT研發崗位的結構化個人履歷模板,完整涵蓋求職核心資訊模組。基本資訊區包含姓名、電話、信箱、求職意願及GitHub連結;專業概要要求以2-3句提煉核心優勢;工作經驗以「公司A高級Java開發工程師」為例,以「透過(行動),達成(量化成果)」格式呈現微服務架構設計、系統效能優化、團隊技術規範制定等職責,公司B經歷則聚焦功能模組開發與Elasticsearch搜尋優化;技能專長分程式語言、後端框架、中介軟體、資料庫、容器雲等維度,清楚展示技術堆疊;專案成果以「電商平台秒殺系統」為例,說明技術棧、架構設計、個人貢獻(Redis Lua庫存原子扣減)及KPI;教育背景包含一流大學電腦專業學歷,以及AWS認證解決方案架構師、軟考中級軟體設計師證書。模板邏輯嚴謹,涵蓋IT研發求職全流程關鍵訊息,幫助求職者清晰、量化展示專業能力。
Top 10 algorithms in artificial intelligence
1. Linear regression
definition
(Linear Regression) is probably the most popular machine learning algorithm. Linear regression is to find a straight line and make this straight line fit the data points in the scatter plot as closely as possible. It attempts to represent the independent variables (x values) and numerical results (y values) by fitting a straight line equation to this data. This line can then be used to predict future values!
The most commonly used technique for this algorithm is the least squares method. This method calculates a line of best fit that minimizes the perpendicular distance from each data point on the line. The total distance is the sum of the squares of the vertical distances (green line) of all data points. The idea is to fit the model by minimizing this squared error or distance.
For example, simple linear regression, which has one independent variable (x-axis) and one dependent variable (y-axis)
Common applications
For example, predict next year's housing price growth, next quarter's sales of new products, etc. It doesn't sound difficult, but the difficulty of the linear regression algorithm is not to obtain the predicted value, but to be more accurate. For that possibly very small number, how many engineers have spent their youth and hair on it.
2. Logistic regression
definition
Logistic regression is similar to linear regression, but the result of logistic regression can only have two values. If linear regression is predicting an open value, logistic regression is more like doing a yes or no question.
The Y value in the logistic function ranges from 0 to 1 and is a probability value. Logistic functions usually have an S-shaped curve that divides the graph into two regions, making them suitable for classification tasks.
For example, the logistic regression graph above shows the relationship between the probability of passing the exam and study time, and can be used to predict whether you can pass the exam.
Common applications
Logistic regression is often used by e-commerce or takeout platforms to predict users' purchasing preferences for categories.
3. Decision tree
definition
The above is an illustration of a decision tree, in which each branched circle is called a node.
At each node, we ask questions about the data based on the available features. The left and right branches represent possible answers. The final node (i.e. leaf node) corresponds to a predicted value.
The importance of each feature is determined through a top-down approach. The higher the node, the more important its properties are. For example, the teacher in the above example believes that attendance is more important than homework, so the attendance node is higher, and of course the score node is higher.
If linear and logistic regression both end the task in one round, then decision trees (Decision Trees) are a multi-step action. They are also used in regression and classification tasks, but the scenarios are usually more complex and specific.
Common applications
To give a simple example, when a teacher faces students in a class, who are the good students? It seems too crude to simply judge that a student with a score of 90 on the exam is considered a good student, and cannot be based on scores alone. For students whose scores are less than 90 points, we can discuss them separately from aspects such as homework, attendance, and questions.
4. Naive Bayes
definition
Naive Bayes is based on Bayes' theorem, which is the relationship between two conditions. It measures the probability of each class, the conditional probability of each class given the value of x. This algorithm is used in classification problems and yields a binary yes/no result. Take a look at the equation below.
Common applications
Naive Bayes classifier is a popular statistical technique with a classic application in spam filtering
To explain Bayes' theorem in non-terminology is to use the probability of B to occur under condition A to obtain the probability of A occurring under condition B. For example, if a kitten likes you, there is a% chance that it will turn its belly in front of you. What is the probability that the kitten will like you if it turns its belly in front of you? Of course, doing this question is tantamount to scratching the surface, so we also need to introduce other data. For example, if the kitten likes you, there is a b% chance of sticking to you, and a c% chance of purring. So how do we know the probability that a kitten likes us? Through Bayes’ theorem, we can calculate it from the probability of belly turning, sticking and purring.
5. Support vector machine
definition
Support Vector Machine (SVM) is a supervised algorithm for classification problems. A support vector machine attempts to draw two lines between data points with the largest margin between them. To do this, we plot data items as points in n-dimensional space, where n is the number of input features. On this basis, the support vector machine finds an optimal boundary, called a hyperplane, which best separates possible outputs by class labels. The distance between the hyperplane and the nearest class point is called the margin. The optimal hyperplane has the largest margin that classifies points such that the distance between the nearest data point and the two classes is maximized.
Common applications
Therefore, the problem that support vector machines want to solve is how to separate a bunch of data. Its main application scenarios include character recognition, facial recognition, text classification and other recognitions.
6.K-Nearest Neighbor Algorithm (KNN)
definition
The K-Nearest Neighbors (KNN) algorithm is very simple. KNN classifies objects by searching the entire training set for the K most similar instances, or K neighbors, and assigning a common output variable to all these K instances.
The choice of K is critical: smaller values may give a lot of noise and inaccurate results, while larger values are infeasible. It is most commonly used for classification, but is also suitable for regression problems.
The distance used to evaluate the similarity between instances can be Euclidean distance, Manhattan distance, or Minkowski distance. Euclidean distance is the ordinary straight-line distance between two points. It is actually the square root of the sum of the squares of the difference in point coordinates
Common applications
KNN theory is simple and easy to implement, and can be used for text classification, pattern recognition, cluster analysis, etc.
7.K-mean
definition
K-means clusters the data set by classifying it. For example, this algorithm can be used to group users based on purchase history. It finds K clusters in the data set. K-means is used for unsupervised learning, so we only need to use the training data X, and the number of clusters we want to identify K.
The algorithm iteratively assigns each data point to one of K groups based on its characteristics. It selects K points for each K-cluster (called centroids). Based on similarity, new data points are added to the cluster with the closest centroid. This process continues until the center of mass stops changing.
Common applications
In life, K-means plays an important role in fraud detection and is widely used in the fields of automobile, medical insurance, and insurance fraud detection.
8. Random Forest
definition
Random Forest is a very popular ensemble machine learning algorithm. The basic idea of this algorithm is that the opinions of many people are more accurate than the opinions of one individual. In a random forest, we use an ensemble of decision trees (see Decision Trees).
(a) During the training process, each decision tree is constructed based on bootstrap samples from the training set.
(b) During classification, decisions on input instances are made based on majority voting.
Common applications
Random forest has a wide range of application prospects, from marketing to health care insurance. It can be used to model marketing simulations, count customer sources, retention and loss, and can also be used to predict disease risks and patient susceptibility. .
9. Dimensionality reduction
Machine learning problems have become more complex due to the sheer volume of data we are able to capture today. This means training is extremely slow and finding a good solution is difficult. This problem is often called the "curse of dimensionality".
Dimensionality reduction attempts to solve this problem by combining specific features into higher-level features without losing the most important information. Principal Component Analysis (PCA) is the most popular dimensionality reduction technique.
Principal component analysis reduces the dimensionality of a data set by compressing it into low-dimensional lines or hyperplanes/subspaces. This preserves as much of the salient features of the original data as possible.
An example of dimensionality reduction can be achieved by approximating all data points to a straight line.
10.Artificial Neural Network (ANN)
definition
Artificial Neural Networks (ANN) can handle large and complex machine learning tasks. A neural network is essentially a set of interconnected layers composed of weighted edges and nodes, called neurons. Between the input layer and the output layer, we can insert multiple hidden layers. Artificial neural networks use two hidden layers. Beyond that, deep learning needs to be dealt with.
Artificial neural networks work similarly to the structure of the brain. A group of neurons is given a random weight to determine how the neuron processes the input data. The relationship between input and output is learned by training a neural network on input data. During the training phase, the system has access to the correct answers.
If the network doesn't accurately recognize the input, the system adjusts the weights. After sufficient training, it will consistently recognize the correct patterns.
Each circular node represents an artificial neuron, and the arrows represent connections from the output of one artificial neuron to the input of another.
Common applications
Image recognition is a well-known application of neural networks.