MindMap Gallery PMP136 tools
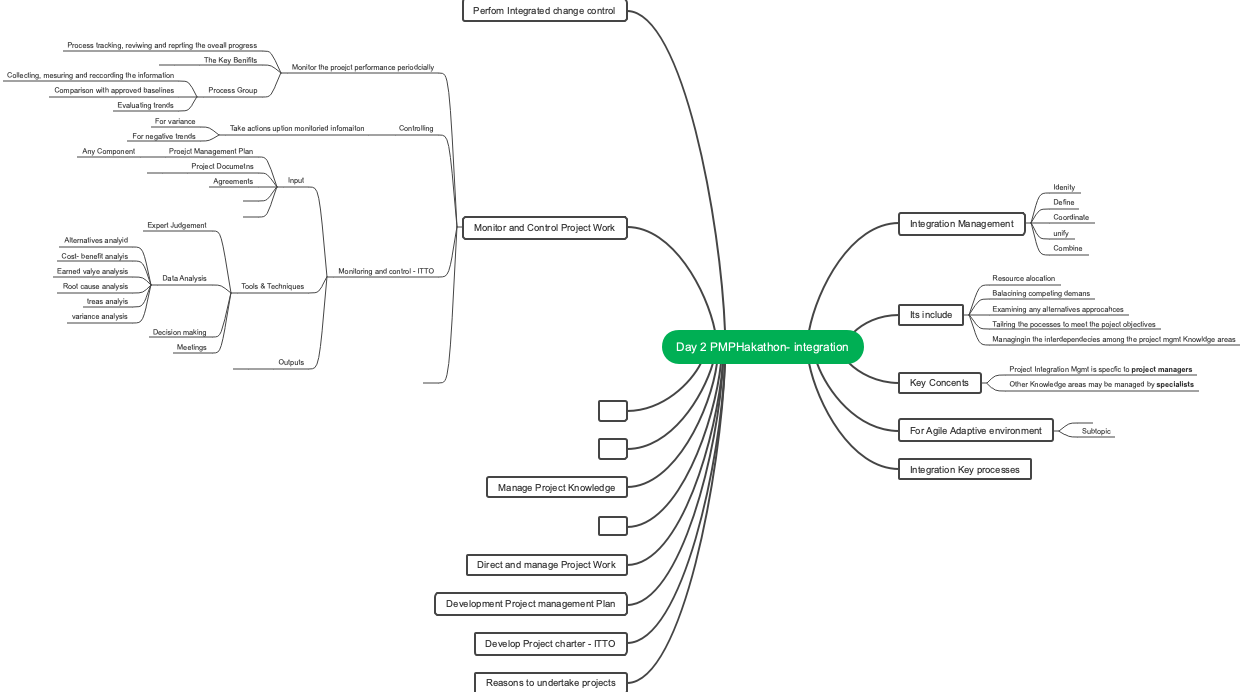
PMP136 Tools,PMP project management, PMBOK sixth edition knowledge structure organization,(PMBOK 6th Edition) Essential for studying and preparing for exams, 49 process tests,The ten knowledge areas of PMP, the input and output of the five process groups,PMP Exam—Knowledge Points Review (PMBOK Sixth Edition).
Edited at 2024-09-05 10:06:21Rumi: 10 dimensões do despertar espiritual. Quando você para de se procurar, encontrará o universo inteiro porque o que está procurando também está procurando por você. Qualquer coisa que você persevera todos os dias pode abrir uma porta para as profundezas do seu espírito. Em silêncio, deslizei para o reino secreto e gostei de tudo para observar a magia ao meu redor e não fiz barulho. Por que você gosta de rastejar quando nasce com asas? A alma tem seus próprios ouvidos e pode ouvir coisas que a mente não pode entender. Procure para dentro para a resposta a tudo, tudo no universo está em você. Os amantes não acabam se encontrando em algum lugar, e não há despedida neste mundo. Uma ferida é onde a luz entra em seu coração.
A insuficiência cardíaca crônica não é apenas um problema da velocidade da freqüência cardíaca! É causada pela diminuição da contração miocárdica e da função diastólica, o que leva a um débito cardíaco insuficiente, o que, por sua vez, causa congestão na circulação e congestão pulmonar na circulação sistêmica. Das causas, o indução aos mecanismos de compensação, os processos fisiopatológicos de insuficiência cardíaca são complexos e diversos. Ao controlar o edema, reduzir a frente e pós -carga do coração, melhorando a função de conforto cardíaco e prevenindo e tratando as causas básicas, podemos efetivamente responder a esse desafio. Somente entendendo os mecanismos e as manifestações clínicas da insuficiência cardíaca e as estratégias de prevenção e tratamento, podemos proteger melhor a saúde do coração.
A lesão de isquemia-reperfusão é um fenômeno que a função celular e os distúrbios metabólicos e os danos estruturais piorarão depois que órgãos ou tecidos restauram o suprimento sanguíneo. Seus principais mecanismos incluem aumento da geração de radicais livres, sobrecarga de cálcio e o papel dos microvasculares e leucócitos. O coração e o cérebro são órgãos danificados comuns, manifestados como mudanças no metabolismo do miocárdio e mudanças ultraestruturais, diminuição da função cardíaca etc. As medidas de prevenção e controle incluem remover os radicais livres, reduzir a sobrecarga de cálcio, melhorar o metabolismo e controlar as condições de reperfusão, como baixo sódio, baixa temperatura, baixa pressão, etc. A compreensão desses mecanismos pode ajudar a desenvolver opções eficazes de tratamento e aliviar lesões isquêmicas.
Rumi: 10 dimensões do despertar espiritual. Quando você para de se procurar, encontrará o universo inteiro porque o que está procurando também está procurando por você. Qualquer coisa que você persevera todos os dias pode abrir uma porta para as profundezas do seu espírito. Em silêncio, deslizei para o reino secreto e gostei de tudo para observar a magia ao meu redor e não fiz barulho. Por que você gosta de rastejar quando nasce com asas? A alma tem seus próprios ouvidos e pode ouvir coisas que a mente não pode entender. Procure para dentro para a resposta a tudo, tudo no universo está em você. Os amantes não acabam se encontrando em algum lugar, e não há despedida neste mundo. Uma ferida é onde a luz entra em seu coração.
A insuficiência cardíaca crônica não é apenas um problema da velocidade da freqüência cardíaca! É causada pela diminuição da contração miocárdica e da função diastólica, o que leva a um débito cardíaco insuficiente, o que, por sua vez, causa congestão na circulação e congestão pulmonar na circulação sistêmica. Das causas, o indução aos mecanismos de compensação, os processos fisiopatológicos de insuficiência cardíaca são complexos e diversos. Ao controlar o edema, reduzir a frente e pós -carga do coração, melhorando a função de conforto cardíaco e prevenindo e tratando as causas básicas, podemos efetivamente responder a esse desafio. Somente entendendo os mecanismos e as manifestações clínicas da insuficiência cardíaca e as estratégias de prevenção e tratamento, podemos proteger melhor a saúde do coração.
A lesão de isquemia-reperfusão é um fenômeno que a função celular e os distúrbios metabólicos e os danos estruturais piorarão depois que órgãos ou tecidos restauram o suprimento sanguíneo. Seus principais mecanismos incluem aumento da geração de radicais livres, sobrecarga de cálcio e o papel dos microvasculares e leucócitos. O coração e o cérebro são órgãos danificados comuns, manifestados como mudanças no metabolismo do miocárdio e mudanças ultraestruturais, diminuição da função cardíaca etc. As medidas de prevenção e controle incluem remover os radicais livres, reduzir a sobrecarga de cálcio, melhorar o metabolismo e controlar as condições de reperfusão, como baixo sódio, baixa temperatura, baixa pressão, etc. A compreensão desses mecanismos pode ajudar a desenvolver opções eficazes de tratamento e aliviar lesões isquêmicas.
PMP 136 tools
Interpersonal and team skills
guide
The facilitator ensures that participants participate effectively, understand each other, and consider all opinions, Fully support the conclusions reached according to the established decision-making process
nominal group
Rank ideas by voting, Used to facilitate brainstorming
It consists of four steps: 1.Ask a question to the group. Everyone writes their own thoughts. 2. Express opinions without discussion. 3. Discuss and evaluate. 4. Individuals vote privately to prioritize various ideas, Usually a 5-point scale is used, with 1 being the lowest and 5 being the highest. To reduce the number of ideas and focus on them, several rounds of voting can be conducted. After each round of voting, the votes will be counted, Select the ideas with the highest scores.
observe and talk
Also known as work following, standing by, participatory
Work tracking
Can't say: keep it secret; don't want to say: chicken thief; can't say: too stupid;
guided seminar
Cross-functional, support people, focus discussions
Often used in joint application development, where users and the project team jointly define requirements. A structured approach to converting user needs into product features
conflict management
Sources of conflict include resource scarcity, schedule prioritization, and personal work style differences
Retreat avoidance: low status, little power
Moderation and tolerance: seeking common ground while reserving differences, and making peace with each other
Compromise and Mediation: Each side gives in. lose-lose
Coercion: Promoting the views of one party at the expense of others. Often leads to win-lose situations
Collaborative solution: Adopting a cooperative attitude to reach consensus can lead to a win-win situation
Conference management
This includes preparing the agenda, ensuring representatives from each key stakeholder group are invited, and preparing and sending follow-up meeting minutes and action plans.
negotiation
Negotiate with functional managers to obtain the best resources; negotiate with suppliers; negotiate among team members to help build a harmonious relationship of mutual trust
The preferred method of resolving all claims and disputes
excitation
Improve the team's ability to participate in decision-making and encourage them to work independently
Team building
Organize various activities to strengthen the team’s social relationships and create a positive and cooperative working relationship
Recognition and Rewards
Get opportunities for growth, get a sense of accomplishment, and get appreciation
training
All activities that improve the capabilities of project team members
Individual and team assessment
Such as attitude surveys, structured interviews, ability tests and focus groups
Make decisions
Influence
Persuade others, express opinions and positions clearly, and listen actively and effectively; understand and consider various viewpoints in any situation; collect relevant information, solve problems and reach consensus while maintaining mutual trust
leadership
Ability to lead and motivate a team to do a good job
active listening
Includes notification of receipt, clarification and confirmation of information, understanding, and removal of barriers to understanding
interpersonal communication
Interact with others to exchange information and build connections
data collection
Interview
face to face
Brainstorming
Face to face, fast, not objective
focus group
Support people, multi-person interaction, divided into groups
Speed, synergy, stimulation, spontaneity, inspiration, professional hosting
Questionnaire
Suitable for: Diverse audiences, need to complete surveys quickly, geographically dispersed respondents, and suitable for statistical analysis
Benchmarking
Compare with other organizations, either internal or external
Provide a basis for performance appraisal
Find role models and comparisons
checklist, counting sheet
Reasonably arrange various items and effectively collect useful data on potential quality issues.
statistical sampling
Used for measurement control and quality confirmation, characterized by cost saving and rapid
Plan quality management to determine sampling frequency and scale
Checklist
Includes a list of items, actions or points to consider
market research
Examine industry conditions and specific seller capabilities
data analysis
File analysis
Documentation includes: Agreement; Business Plan; Business Process and Interface Documentation; Current Processes; Market Literature; Issue Log; Policies and Procedures; Regulatory Documents
Alternatives Analysis
Such as which scheduling methods are used and how to integrate different methods into the project
Reserve analysis
A contingency reserve, also known as a schedule reserve, is a duration included in the schedule baseline for identified risks that have been accepted. Related to “known-unknown” risks, contingency reserves can be drawn down, reduced, or eliminated.
Management reserves, specially set aside project budgets to cover unforeseen work within the project scope. Related to “unknown – unknown” risks that are not included in the schedule baseline but are part of the total project duration. Using management reserves may require changes to the progress baseline
What-if scenario analysis
Consider various scenarios, "What would happen if scenario X occurred?"
Simulation - Monte Carlo Analysis
Based on many different assumptions, constraints, risks or scenarios, Use probability distribution representations to calculate multiple possible work package durations
Iterative burndown chart
Calculate trends based on remaining work to predict completion
Earned Value Analysis (EVA)
Schedule performance measurement indicators used to evaluate deviations from schedule baselines
Key points: CV SV CPI SPI
cost variable
schedule variable
Cost-benefit analysis
A financial analysis tool used to estimate the advantages and disadvantages of alternatives to determine which alternatives will create the best benefits
Investment = back guarantee, best quality. quality is free
quality cost
Prevention costs (consistency costs)
Prevent the costs caused by inferior project products
Evaluation cost (consistency cost)
Costs incurred by evaluating, measuring, auditing, and testing products for a specific project
Cost of failure (internal/external) (Cost of non-conformity)
The cost incurred if the product is inconsistent with the expectations of relevant parties
Increase prevention costs, reduce evaluation costs, and try to avoid failure costs
Assumptions and constraints
Check the hypothesis log
SWOT analysis
A case-by-case examination of the project’s Strengths, Weaknesses, Opportunities and Threats (SWOT)
Risk data quality assessment
Evaluate the accuracy and reliability of data regarding individual project risks
Risk probability and impact assessment
The likelihood of characteristic risks occurring and their impact on the project
Risks with low probability risks and impacts will be placed on a watch list in the risk register for future monitoring
sensitivity analysis
tornado diagram
Determine which individual risks have the greatest potential impact on project outcomes, Each feature is arranged in descending order of association strength, forming a tornado shape
Decision tree analysis
Choose the best solution among alternatives, use different branches to represent different decisions, calculate the expected monetary value of each branch, and select the optimal path
influence diagram
Graphical aids to decision making under uncertainty
Represents the causal relationship between variables and results, the temporal sequence of events
Threat response strategy
Report
Exceeds the authority of the project manager
Once a threat is reported, there will be no further oversight by the project team
avoid
Change plans to complete elimination of threats, such as reducing scope, canceling work, extending schedule
transfer
Transfer the risk impact and response responsibilities to a third party and pay the risk fees. Examples: insurance, bonds, bonds, contracts; subcontracting of critical work
alleviate
Reduce the probability and impact of threats, such as: adopting simpler processes; choosing more reliable suppliers; conducting more tests; drawing prototypes;
accept
Low-priority threats, acknowledge the existence of threats, and continue to promote project progress according to the current situation
A common active acceptance strategy is to establish a contingency reserve; a passive acceptance strategy is not to take active measures but to regularly review threats.
Opportunity coping strategies
Report
Opportunities are usually escalated to the level that will be affected by the opportunity
open up
Ensure that opportunities occur 100% of the time, such as allocating the most capable resources to the project to shorten the construction period; Adopt technology upgrades to reduce costs; Add high-yield jobs to improve efficiency; Negotiate modifications to risk thresholds to include opportunities
share
Share responsibilities for corresponding opportunities with capable third parties, such as establishing partnerships and collaborative teams
improve
Increase the probability and impact of an opportunity, e.g. adding resources to complete an activity sooner
accept
Acknowledges the existence of opportunities but does not take proactive measures, suitable for low-priority opportunities
Overall project risk response strategy
circumvent, exploit, transfer or share, alleviate or improve, accept
emergency response strategies
Also known as contingency plan, rebound plan
Design some response measures that will only be used when specific events occur. The trigger conditions for emergency response strategies should be defined and tracked, such as: intermediate milestones not being achieved.
Data performance
mind Mapping
Integrate the ideas obtained from brainstorming into a picture to reflect the commonalities and differences between the ideas
Affinity diagram
Used to categorize large numbers of ideas for further review and analysis
flow chart
Show the interrelationships between steps in the process
Matrix diagram
Show the strength of the relationship between factors, causes, and goals where rows and columns intersect. Helps identify quality measures critical to project success
process analysis
Examine problems, constraints and non-value-added activities encountered during the process
Eliminate non-value-added links and strengthen value-added
Lean Six Sigma
Cause and effect diagram, fishbone diagram, Ishikawa diagram
Helps identify the root cause of a problem
Histogram
Display the number of defects for each deliverable and the arrangement of causes of defects
Pareto chart
Special histograms that identify the few important causes of most problems. The 80/20 rule; sort by frequency of occurrence and take corrective measures in a focused manner
Scatter plot
Show the relationship between two variables. One axis represents any element such as process and environment, and the other axis represents quality defects.
Control Charts
Determine whether the project management process is in control and has predictable performance.
Control upper and lower limits, 7-point rule
If the process is within normal limits, it should not be adjusted; if the process is out of control, it must be adjusted.
chart
hierarchical
Such as work breakdown structure, organizational breakdown structure, resource breakdown structure
text type
More suitable for recording detailed responsibilities
Responsibility Assignment Matrix
RACl Matrix (Executive, Responsible, Consulted and Informed)
hierarchy diagram
Display three-dimensional data, X-axis, Y-axis, and bubble size to represent the three parameters of risk
decision making
vote
unanimously agreed
everyone agrees
Most agree
More than 50% staff support
A relative majority agrees
Usually used when there are more than two candidates
Raise your fist to express disapproval, and extend five fingers to express full support. Continue a show of hands until the entire group reaches a consensus (everyone holds up three or more fingers)
autocratic decision-making
One person makes decisions for the entire group
Multi-criteria decision analysis
Establish multiple criteria, such as: risk level, value and return, etc., to evaluate and rank numerous ideas
prototype method
Create a model of the product first, and then collect early demand feedback to support the concept of progressive detailing
project management information system
Such as: schedule planning software, company knowledge base
*** systems are business environment factors, *** procedures are organizational process assets
Delphi technique
Anonymous, back to back, objective, too slow
Ask questions and respond anonymously in writing; summarize opinions and distribute revisions; Summarize again, revise again; remain anonymous until consensus is reached
product analysis
Product decomposition, demand analysis, value analysis, value engineering
Transform high-level product statements into tangible deliverables
break down
Break down the scope of work into smaller tasks
The work package is the lowest level of work in the WBS, and its cost and duration can be estimated and managed.
The degree of decomposition depends on the degree of control required
By summarizing all the work at the bottom of the WBS layer by layer, we ensure that there is no omission or redundant work. This is called the 100% rule.
rolling planning
An iterative planning technique that combines detailed planning of near-term work with rough planning of future work at a higher level
In the early strategic planning stages, the information is not clear enough and the work packages can only be broken down to a known level of detail; later, as more information is learned, the work packages to be implemented in the near future can be broken down into specific activities.
Thin near and thick at far, more near and less far
Predecessor Drawing Method (PDM)
It is a tool for creating progress models, using nodes to represent activities. Use one or more logical relationships to connect activities to show the order in which they are performed.
PDM includes four dependencies or logical relationships
Finish to start FS
Commonly used
Complete to Complete FF
start to start SS
Start to finish SF
use less
There may be two logical relationships between two activities at the same time
Arrow Drawing Method (ADM)
The activity name is on the arrow line, and the nodes are just code names.
virtual activity
The construction period is zero and no resources are consumed; it is only used to show logical relationships; it can appear on the critical path;
Determine and integrate dependencies
mandatory dependencies
Legal or contractual requirements, the inherent nature of the work, and often related to objective constraints.
Also called hard logical relationship or hard dependency relationship
selective dependency
Also known as preferred logical relationship, priority logical relationship or soft logical relationship
If fast tracking is planned, the corresponding optional dependencies should be reviewed, and consider whether adjustments or removal are needed
internal dependencies
Antecedent relationships between project activities, usually within the control of the project team
external dependencies
Dependencies between project activities and non-project activities
Often outside the control of the project team
analogy estimation
Use historical data from similar past projects to estimate the duration or cost of the current project;
It is a rough estimating method often used to estimate project duration in the early stages of a project when detailed information is insufficient.
Low cost, fast, poor accuracy
Key points: Essential similarity, not superficial similarity; the estimating team members are very professional
parameter estimation
An estimating technique that uses an algorithm to calculate cost or duration based on historical data and project parameters.
Use statistical relationships between historical data and other variables to estimate, such as: duration = total workload / average daily workload
Accuracy depends on the maturity of the parameter model and the reliability of the underlying data
three point estimate
Program Review Technology PERT: The most pessimistic construction period (tP), The most likely construction period (tM), The most optimistic construction period (tO), Calculate the average duration.
It is a beta distribution, PERT formula: (P 4M O) / 6. The probability of completion within this construction period is 50%
It is a triangular distribution, PERT formula: (P M O) / 3. The probability of completion within this construction period is 50%
Standard deviation formula: (P-O)/6. Using a normal statistical distribution chart, the construction period falls on the average construction period The probability of being within one standard deviation is 68.26%, The probability of being within two standard deviations is 95.46%, The probability of being within three standard deviations is 99.73%. If a standard deviation is used to estimate the construction period, then the construction period is within the average construction period. plus or minus one standard deviation.
Variance is the square of the standard deviation
Accounts for uncertainty and risk in estimates
standard deviation
The gap between rich and poor
The standard deviations of each activity cannot be added, only the variances can be added
The most pessimistic and optimistic levels of dispersion
The standard deviations of each activity cannot be added together.
variance
standard deviation squared
The variances of each activity can be summed
Bottom-up estimation
Summarize the estimates of WBS components layer by layer from bottom to top to obtain the project estimate.
Progress network analysis
Is a tool for creating progress models, modeling technology
critical path method
It is used to estimate the shortest duration of the project and is the longest activity sequence in the project.
The critical path has zero total float
A progress network diagram may have multiple critical paths
When multiple paths converge or diverge at the same point in time, evaluate the need to aggregate schedule reserves to reduce the possibility of schedule delays.
Review the network to see if there are high-risk activities on the critical path, or activities with a large lead time, and whether it is necessary to use schedule reserves or implement risk response plans to reduce the risk of the critical path
Resource optimization
resource balancing
Shared resources or critical resources are only available at specific times and in limited quantities, Or be over-allocated, resource balancing is required.
Often results in critical path changes because float can be used to balance resources
Resource smoothing
The project critical path will not be changed and the completion date will not be delayed, Delayed only within its free and float time
Progress compression
Without reducing the project scope, the schedule period was shortened and the mandatory date target was met.
rush work
Increase resource investment and trade resources for time. May result in increased risks and costs
Quick follow up
Activities are carried out in parallel, potentially resulting in rework and increased risk
Change the logical relationship of activities and increase project risks
cost summary
Cost estimates are rolled up to work packages, to control accounts, and ultimately to total costs
Financing
Obtain funding for projects
audit
quality audit
Identify any irregularities, gaps and deficiencies
risk audit
Assess the effectiveness of risk management processes
Ensure risk audits are conducted at the frequency specified in the project risk management plan
Procurement audit
Conduct a structured review of the procurement process and summarize lessons learned for use in future procurement projects
risk review meeting
Regularly schedule risk reviews to check and document the effectiveness of risk responses in addressing overall risks and individual risks
Reassess current risks and close outdated risks. Summarize experience and lessons
x-oriented design
Optimize specific aspects of design such as reliability, availability, safety, cost, quality
Reduce costs, improve quality, increase performance and customer satisfaction
problem solved
Define the problem; identify root causes; generate possible solutions; select the best solution; implement the solution; verify the effectiveness of the solution
quality improvement methods
Analyze and evaluate opportunities for improvement to improve the quality of project management and the quality of the final product
Deming Circle: (PDCA) Plan, Do, Check, Act
Six Sigma
pre-dispatch three kinds of people
The person named in the project charter
The person promised in the bid document
Specially scarce professionals
virtual team
telecommute. More time is needed to set clear expectations, facilitate communication, develop conflict resolution methods, bring people together in decision-making, understand cultural differences, and share the joy of success
Centralized office
Enhance teamwork by colocating the most active project members in the same physical location. Can be either temporary or throughout the project
Communication needs analysis
Number of potential communication channels = N(N-1)/2
Organization Chart
Responsibilities, relationships and interdependencies between the project organization and relevant parties
The disciplines, departments and majors involved in the project;
How many people are involved in the project and where;
Internal information needs (how to communicate within the organization)
external information needs (such as when to communicate with the media, the public or contractors);
communication technology
Factors that influence the choice of communication technology include: urgency of information need, availability and reliability of technology, ease of use, project environment, feedback, communication competencies, non-verbal skills, presentation, sensitivity and confidentiality of information
communication model
Encoding, sending, decoding, confirming receipt, feedback on understanding
The most important thing in communication is not what you express, but what the other party receives and understands
communication method
1Interactive communication
Consensus needs to be reached quickly, information exchanged in real time: Telephone conference
2Push communication
Not much information and objects. Send emails, reports, letters, press releases to recipients
3 pull communication
There is a lot of information and objects. Build websites, write Weibo, bulletin boards, online courses
Main communication needs
Interpersonal communication, face-to-face; group communication, three to six people; Public communication, to a group of people; mass communication, to a person or group sending information; Network and social communication tools
communication skills
communication competency
Helps clarify the purpose of key information, build effective relationships, enable information sharing and take leadership actions.
feedback
Reactive information about communications, deliverables, or situations, such as coaching, coaching, and consultation.
nonverbal skills
Convey meaning through appropriate body language such as gestures, intonation and facial expressions
Demo
A presentation is the formal delivery of information and documents.
type of contract
lump sum contract
Fixed Total Price FFP: Favorite
Total Price Incentive Fee FPIF
Total Price Economic Price Adjustment Contract FP-EPA
cost reimbursement contract
Cost fixed fee CPFF (fixed amount)
Cost Incentive fee CPIF (shared proportional incentive)
lowest fee
Cost Award Fee CPAF (Subjective Judgment Award)
Work and materials contract time and means contract
Work and materials contract: scope is very unclear; cost compensation: somewhat clear; lump sum contract: very clear
Work and material contracts are fast
Supplier selection analysis
State the evaluation method in the procurement documents so bidders understand how they will be evaluated
sole source
Select only specific sellers
fixed budget
Make choices based on fixed costs
Qualifications only
For small quantity purchases, select suppliers that meet the requirements through a defined short list
lowest cost
Suitable for standardized or routine procurement
Score based on quality or technical solutions
bidders meeting
The purpose is to ensure that all bidders have a clear and consistent understanding of the procurement requirements
And make sure no bidder gets special treatment. Fair! !
Stakeholder mapping analysis
related cube
Methods for classifying relevant parties, such as: power and interest grid, power influence grid, role influence grid
Role refers to the ability of interested parties to change the project plan or execution
Influence refers to the extent to which interested parties proactively participate in the project
Interest refers to the extent to which stakeholders care about the results of the project
Power refers to the authority of the relevant parties
highlight model
Used to determine the relative importance of identified parties by assessing their power, urgency, and legitimacy
Influence direction
Up, down, outward, sideways
Prioritization
If there are a large number of relevant parties with frequent changes and complex relationships, it is necessary to prioritize them.
Stakeholder Engagement Assessment Matrix
Compare stakeholder engagement levels to expectations
Participation levels are divided into: unaware type; resistant type; neutral type; supportive type; leadership type;