MindMap Gallery BYD Market Segmentation, Targeting and Positioning Analysis
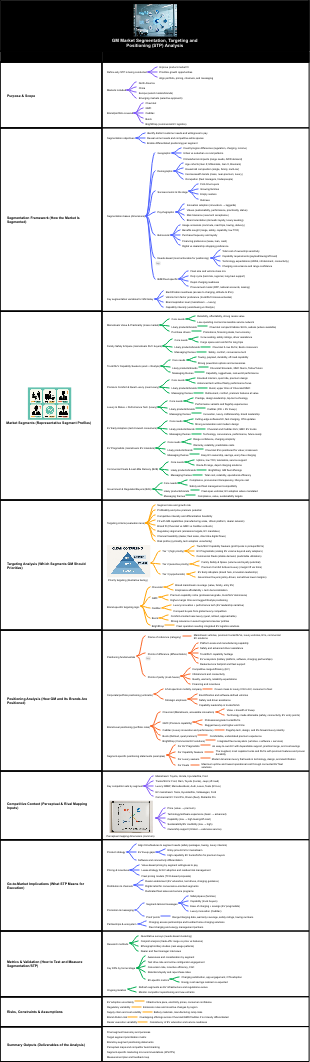
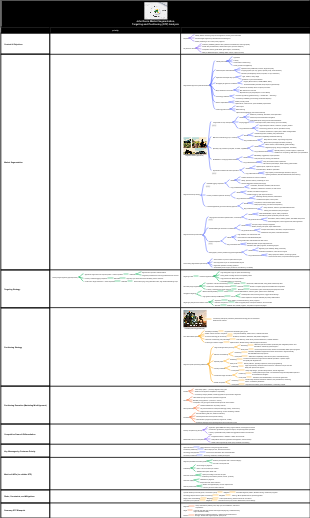
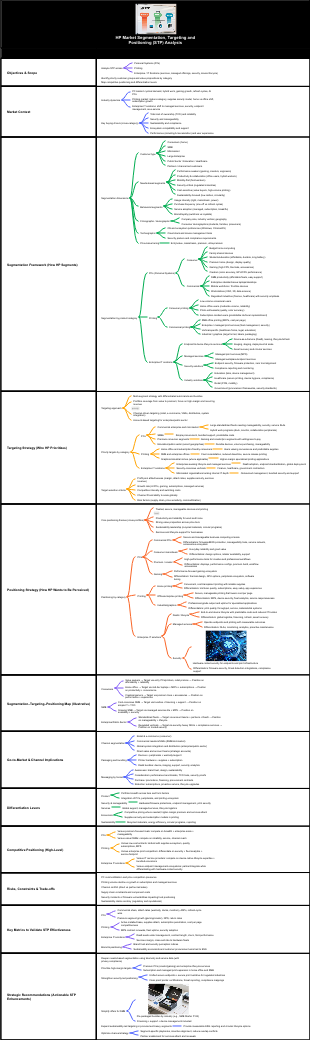
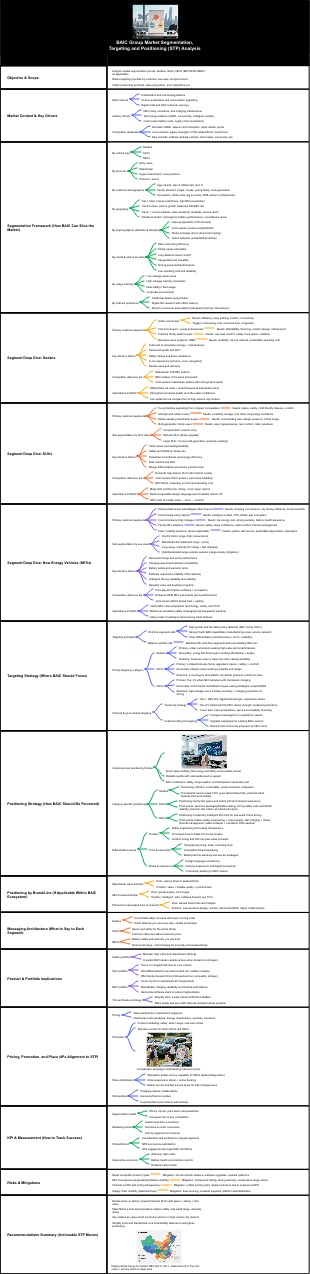
This analysis explores BYD’s market segmentation, targeting, and positioning (STP) framework, offering insights into how the company tailors its offerings across Battery Electric Vehicles (BEVs), Hybrid Vehicles, and Battery Storage Solutions. Key objectives include identifying priority targets across regions and customer types, and clarifying positioning themes centered on technology, cost, safety, and scalability. The segmentation framework employs a multi-dimensional approach. Geographic segmentation distinguishes mature markets (Europe, China) from emerging regions. Demographic segmentation considers age, income, and household composition. Psychographic segmentation captures environmental consciousness, technology adoption, and brand affinity. Behavioral segmentation examines purchase patterns and usage occasions. Needs-based segmentation identifies priorities such as affordability, range, safety, and sustainability. Specific customer segments within the EV market include first-time EV buyers seeking affordable, reliable entry points; eco-conscious consumers prioritizing sustainability and technology; fleet operators focused on total cost of ownership and durability; and premium buyers desiring luxury features and performance. Product-based distinctions align with segmentation: Dynasty Series appeals to heritage-conscious buyers; Ocean Series targets younger, tech-savvy consumers; Denza and Yangwang serve premium and ultra-luxury segments. Channel strategies leverage direct sales, digital platforms, dealer networks, and fleet partnerships, adapting to regional preferences and infrastructure. Through this STP framework, BYD effectively meets diverse customer needs across global markets while maintaining a consistent positioning centered on technology leadership and sustainable mobility.
Edited at 2026-03-25 15:19:19Mappa mentale per l’analisi del controllo della gestione del portata di progetto. Tre sezioni principali: 1. WBS Scope Breakdown – scomposizione gerarchica del lavoro con dettaglio dello Scopo del progetto. 2. Scope Boundary / Exclusions – definizione chiara dei confini del progetto e di ciò che è escluso per evitare scope creep. Strumento ideale per project manager e team di controllo per mantenere allineamento e ridurre rischi.

Questo template, ideato con EdrawMind, è un modello completo per il miglioramento continuo del sistema di gestione della qualità, con una descrizione di circa 500 parole. È strutturato come un diagramma a lisca di pesce, strumento efficace per analizzare le cause principali dei problemi di qualità e definire le leve di controllo necessarie per risolverli. Il processo è organizzato in quattro fasi chiave: la prima è lo standard e la pianificazione, dove si definiscono gli obiettivi di qualità, i criteri di accettazione, i requisiti di prova e le porte di qualità (Quality Gate). La seconda fase analizza i processi e le porte di controllo, per garantire che ogni passaggio del lavoro segua i standard stabiliti. La terza fase riguarda l’esecuzione QA/QC, con la definizione di metodi di prova e ispezione, nonché regole per la gestione dei difetti e delle non conformità. L’ultima fase è il miglioramento e le azioni correttive e preventive (CAPA), insieme a una catena di audit per monitorare l’efficacia delle misure adottate. In basso, una tabella "Quality Gate" permette di tracciare ogni punto di controllo, con criteri specifici, metodi di prova, proprietario e stato di avanzamento. Grazie alla visualizzazione chiara e intuitiva di EdrawMind, questo strumento aiuta il team a identificare le cause root dei problemi di qualità, implementare azioni efficaci e mantenere un ciclo di miglioramento continuo, garantendo la qualità finale del prodotto o servizio.
Questo template, creato con EdrawMind, è un modello di piano di comunicazione ottimizzato, con una descrizione di circa 500 parole. È uno strumento chiave per evitare incomprensioni tra stakeholder, garantire la trasparenza e mantenere il team allineato agli obiettivi del progetto. Il modello è composto da tre elementi fondamentali e interconnessi: la matrice di comunicazione, la cadenza timeline e le regole di comunicazione/SLA. La matrice di comunicazione è una tabella dettagliata dove per ogni pubblico o stakeholder, si definisce il tipo di informazioni da condividere, lo scopo della comunicazione, il canale da utilizzare (email, riunioni, piattaforme di progetto), la frequenza, il proprietario responsabile, il formato e il percorso di escalazione in caso di problemi. La cadenza timeline è una linea temporale che definisce le scadenze delle comunicazioni chiave, garantendo che le informazioni siano condivise in momento opportuno e non si verifichino ritardi o omissioni. Le regole di comunicazione e gli accordi sul livello di servizio (SLA) definiscono le norme formali della comunicazione, come i tempi di risposta, il tono da adottare e le responsabilità di ciascun membro del team. Grazie alla struttura visuale di EdrawMind, questo template permette di pianificare la comunicazione in modo strategico, trasparente e efficiente, riducendo i rischi di cattiva informazione, migliorando la collaborazione e garantendo che tutti gli stakeholder siano informati e coinvolti nel progetto.
Mappa mentale per l’analisi del controllo della gestione del portata di progetto. Tre sezioni principali: 1. WBS Scope Breakdown – scomposizione gerarchica del lavoro con dettaglio dello Scopo del progetto. 2. Scope Boundary / Exclusions – definizione chiara dei confini del progetto e di ciò che è escluso per evitare scope creep. Strumento ideale per project manager e team di controllo per mantenere allineamento e ridurre rischi.
Questo template, ideato con EdrawMind, è un modello completo per il miglioramento continuo del sistema di gestione della qualità, con una descrizione di circa 500 parole. È strutturato come un diagramma a lisca di pesce, strumento efficace per analizzare le cause principali dei problemi di qualità e definire le leve di controllo necessarie per risolverli. Il processo è organizzato in quattro fasi chiave: la prima è lo standard e la pianificazione, dove si definiscono gli obiettivi di qualità, i criteri di accettazione, i requisiti di prova e le porte di qualità (Quality Gate). La seconda fase analizza i processi e le porte di controllo, per garantire che ogni passaggio del lavoro segua i standard stabiliti. La terza fase riguarda l’esecuzione QA/QC, con la definizione di metodi di prova e ispezione, nonché regole per la gestione dei difetti e delle non conformità. L’ultima fase è il miglioramento e le azioni correttive e preventive (CAPA), insieme a una catena di audit per monitorare l’efficacia delle misure adottate. In basso, una tabella "Quality Gate" permette di tracciare ogni punto di controllo, con criteri specifici, metodi di prova, proprietario e stato di avanzamento. Grazie alla visualizzazione chiara e intuitiva di EdrawMind, questo strumento aiuta il team a identificare le cause root dei problemi di qualità, implementare azioni efficaci e mantenere un ciclo di miglioramento continuo, garantendo la qualità finale del prodotto o servizio.
Questo template, creato con EdrawMind, è un modello di piano di comunicazione ottimizzato, con una descrizione di circa 500 parole. È uno strumento chiave per evitare incomprensioni tra stakeholder, garantire la trasparenza e mantenere il team allineato agli obiettivi del progetto. Il modello è composto da tre elementi fondamentali e interconnessi: la matrice di comunicazione, la cadenza timeline e le regole di comunicazione/SLA. La matrice di comunicazione è una tabella dettagliata dove per ogni pubblico o stakeholder, si definisce il tipo di informazioni da condividere, lo scopo della comunicazione, il canale da utilizzare (email, riunioni, piattaforme di progetto), la frequenza, il proprietario responsabile, il formato e il percorso di escalazione in caso di problemi. La cadenza timeline è una linea temporale che definisce le scadenze delle comunicazioni chiave, garantendo che le informazioni siano condivise in momento opportuno e non si verifichino ritardi o omissioni. Le regole di comunicazione e gli accordi sul livello di servizio (SLA) definiscono le norme formali della comunicazione, come i tempi di risposta, il tono da adottare e le responsabilità di ciascun membro del team. Grazie alla struttura visuale di EdrawMind, questo template permette di pianificare la comunicazione in modo strategico, trasparente e efficiente, riducendo i rischi di cattiva informazione, migliorando la collaborazione e garantendo che tutti gli stakeholder siano informati e coinvolti nel progetto.
BYD Market Segmentation, Targeting and Positioning (STP) Analysis
Scope & Objectives
Segment BYD markets across
Battery Electric Vehicles (BEVs)
Hybrid Vehicles (PHEVs/HEVs, e.g., DM-i/DM-p)
Battery Storage Solutions (BESS: residential, C&I, utility-scale)
Identify priority targets by region, customer type, and use case
Clarify positioning themes and proof points (technology, cost, safety, scale)
Market Segmentation Framework
Segmentation Dimensions (applies across categories)
Geographic
China (home market scale, policy support, intense competition)
Asia-Pacific (SE Asia, Australia, Japan)
Europe (regulation-led electrification, safety standards, brand perception)
Latin America (fleet economics, infrastructure constraints)
Middle East & Africa (hot-climate performance, infrastructure variability)
North America (limited exposure for BYD passenger cars; stronger in buses/commercial)
Demographic / Firmographic
Consumers: income bands, household size, life stage
Organizations: fleet size, industry (logistics, transit), procurement sophistication
Psychographic
Value seekers vs tech enthusiasts vs status/brand-driven
Eco-conscious vs pragmatic cost reducers
Risk aversion (battery safety, reliability)
Behavioral / Use-case
Commute distance; charging access (home/work/public)
Performance needs (acceleration, towing, payload)
Ownership model (private, subscription, leasing)
Total Cost of Ownership (TCO) sensitivity
Needs-based
Range anxiety mitigation
Charging speed & convenience
Safety & durability
Connectivity/ADAS
After-sales support and warranty
Compliance (emissions, safety, grid codes)
Use region + customer profile + usage behavior + explicit needs to segment consistently across EV, hybrid, and BESS.
EVs (Battery Electric Vehicles) Segmentation
Customer Segments
Entry-level urban commuters
Needs: affordability, compact size, easy charging, low running costs
Pain points: limited charging access, price sensitivity
Mainstream families
Needs: space, safety, comfort, practical range, reliability
Pain points: resale value concerns, charging planning
Tech-forward early adopters
Needs: advanced infotainment, OTA updates, ADAS, novelty features
Pain points: fast feature cycles, software quality expectations
Premium aspirers (upper-mid)
Needs: refined NVH, design, brand signaling, high feature content
Pain points: brand prestige vs established premium marques
Performance-oriented buyers
Needs: acceleration, handling, thermal management, braking
Pain points: track consistency, tire/brake costs
Ride-hailing / mobility operators
Needs: durability, uptime, low energy cost, fast service
Pain points: downtime, battery degradation, service network
Corporate/fleet passenger vehicles
Needs: procurement price + TCO, telematics, maintenance contracts
Pain points: charging depot setup, driver acceptance
Product-Based Segmentation (typical EV line-up lenses)
Vehicle class
Mini/compact cars
Compact/midsize sedans
SUVs/crossovers
MPVs (family/people movers)
Range/energy segment
City range vs long-range variants
Efficiency-first vs performance-first
Feature bundle
Safety/ADAS tiers
Infotainment/connectivity tiers
Interior/material tiers
Channel & Ownership Segmentation
Direct retail vs dealer partners (market-dependent)
Financing/leasing vs cash purchase
Fleet tenders vs consumer retail
Hybrid Vehicles (PHEV/HEV) Segmentation
Core Segments
Range-anxious mainstream buyers (transition segment)
Needs: EV-like driving with fuel backup, no dependency on chargers
Drivers: infrastructure gaps, long-distance travel patterns
High-mileage commuters with limited charging
Needs: fuel efficiency, reliable hybrid system, low maintenance
Drivers: cost of fuel, routine long trips
Families needing long-distance flexibility
Needs: space + long-trip convenience, predictable refueling
Drivers: vacations, intercity travel
Fleet operators in mixed infrastructure regions
Needs: predictable TCO, high utilization, simple operations
Drivers: variable charger availability, uptime requirements
Performance hybrids (where offered)
Needs: torque, AWD, acceleration with efficiency halo
Drivers: “best of both worlds” value proposition
Needs-Based Segmentation (hybrid-specific)
Electric-only commuting capability (short daily trips)
Seamless mode switching and NVH control
Fuel economy under real-world driving
Battery warranty confidence and degradation management
Market Maturity Segmentation
EV-mature markets
Hybrids as interim/bridge or for niche long-distance users
EV-emerging markets
Hybrids as primary electrification path due to limited charging
Battery Storage Solutions (BESS) Segmentation
Customer Segments by Application
Residential storage
Needs: backup power, bill savings, solar self-consumption, safety, aesthetics
Buyers: homeowners with rooftop PV; outage-prone regions
Commercial & Industrial (C&I)
Needs: demand charge reduction, peak shaving, reliability, power quality
Buyers: factories, malls, data centers, hospitals, campuses
Utility-scale / grid storage
Needs: frequency regulation, capacity firming, renewable integration, arbitrage
Buyers: utilities, IPPs, grid operators
Microgrids / off-grid
Needs: diesel displacement, resilience, remote reliability
Buyers: islands, mines, remote communities, defense sites
EV charging infrastructure + storage (hybrid segment)
Needs: reduce grid connection costs, manage peaks, fast-charging support
Buyers: charging network operators, fleet depots
Segmentation by Buyer/Procurement Model
Direct purchase vs EPC-led projects
Utility tender vs bilateral IPP deals
Energy-as-a-Service / leasing models
Segmentation by Technical Requirements
Power/energy duration (e.g., 1–2h vs 4h+)
Safety and thermal management expectations
Footprint constraints (urban vs rural)
Grid code compliance and certifications
Integration needs (EMS, SCADA, cybersecurity)
Targeting Strategy (Who BYD Prioritizes and Why)
EV Target Priorities
High-volume mainstream segments
Rationale: scale advantage, cost leadership, rapid portfolio refresh
Urban and suburban families seeking value + features
Rationale: broad demand, cross-over/SUV popularity
Ride-hailing and fleet channels in suitable markets
Rationale: utilization-driven economics; strong TCO proposition
Select premium-adjacent segments (upper-mid)
Rationale: expand margins and brand elevation while keeping value edge
Hybrid Target Priorities
Markets with charging constraints or long-distance driving patterns
Rationale: immediate addressable market, lower adoption friction
Value-oriented consumers wanting fuel savings without behavior change
Rationale: practical benefit story; broad appeal
Fleet operators needing predictable operations
Rationale: operational simplicity vs full BEV where infrastructure lags
BESS Target Priorities
Utility and large C&I deployments
Rationale: large deal sizes, repeatable project pipelines, scale manufacturing fit
Solar + storage ecosystems (PV owners, developers)
Rationale: complements renewable expansion; integrated energy story
Resilience-focused customers (outage-prone regions, critical loads)
Rationale: high willingness to pay for reliability and safety
Prioritize scaleable demand pools (mainstream EV, infrastructure-light hybrids, large BESS projects) where BYD’s cost, integration, and reliability advantages compound.
Positioning Strategy (How BYD Competes in Each Category)
Brand-Level Positioning Pillars
Technology-driven manufacturer with scale
Vertical integration (cells, packs, power electronics, vehicles)
Safety-first batteries
Emphasis on battery safety narratives and robust engineering
High value at competitive price
Feature-rich trims, cost efficiencies, localized production where applicable
Electrification for the mainstream
Accessible electrified mobility rather than niche luxury-only
EV Positioning
Value + technology bundle
Competitive range/features per price point
Practicality and safety for families
Space, comfort, safety systems, durability
Efficiency and low TCO
Energy efficiency, warranty, serviceability
Differentiation vs key competitor archetypes
vs budget EVs: stronger tech/safety content
vs premium EVs: comparable features at lower price; practical reliability
vs legacy OEM EVs: faster iteration and cost advantage
Hybrid Positioning
Best of both worlds
EV-like daily driving with long-distance freedom
Infrastructure-independent electrification
Reduced dependence on charging buildout
Real-world efficiency
Position around fuel savings and convenience, not only lab metrics
BESS Positioning
Bankable, scalable storage provider
Manufacturing scale, supply security, proven deployments
Safety, cycle life, and reliability
Thermal management, system-level safety design, long-term performance
Integrated solutions
Cells-to-system integration, EMS compatibility, turnkey offerings with partners
Competitive Reference Points (by Category)
EVs
Direct EV specialists (feature velocity, software ecosystems)
Legacy OEMs (brand trust, dealer networks)
Value-focused challengers (price wars, thin margins)
Hybrids
Hybrid incumbents (perceived reliability, long history)
Plug-in hybrid competitors (range and performance comparisons)
BESS
Global integrators and battery manufacturers
Local EPC and solution providers
Differentiators: safety record, cost per kWh, delivery timelines, bankability
Key Differentiators and Proof Points to Support Positioning
Technology & Integration
Control over battery supply chain and product optimization
Fast product iteration across platforms
Cost Leadership
Manufacturing scale and process efficiencies
Platform sharing and localization
Safety & Reliability
Battery safety messaging, testing, warranty structures
Field performance and durability claims (where evidenced)
Ecosystem & After-Sales
Service network growth, parts availability, OTA updates (market-dependent)
Sustainability Narrative
Decarbonization across mobility and energy storage
Potential Positioning Risks & Mitigations
Brand perception gap in premium segments
Mitigation: design quality, quality assurance, independent safety ratings, flagship halo models
Price competition and margin pressure
Mitigation: trim optimization, differentiation via safety/tech, cost control, localized production
Policy/tariff and geopolitical constraints
Mitigation: regional manufacturing/assembly, partnerships, diversified market exposure
Software and user experience expectations
Mitigation: OTA cadence, localized UX, robust QA and customer support
BESS safety concerns industry-wide
Mitigation: certifications, transparent safety engineering, monitoring and fire suppression systems
Strategic STP Implications (Actionable Takeaways)
EVs
Focus messaging by segment
Families: safety + space + value
Commuters: affordability + efficiency
Tech buyers: OTA + ADAS + connectivity
Fleets: TCO + uptime + service contracts
Prioritize high-demand body styles (SUV/crossover) with clear trim ladders
Hybrids
Lead with no-compromise transition narrative in infrastructure-light regions
Offer clear EV-range and efficiency communication to reduce confusion
BESS
Segment-led go-to-market
Utilities: bankability + grid compliance + delivery certainty
C&I: demand savings + resilience ROI
Residential: safety + backup + solar self-consumption
Strengthen partner ecosystem (EPCs, developers, utilities) to scale deployment