MindMap Gallery Decision tree architecture algorithm programming mind map
Decision tree architecture algorithm programming mind map
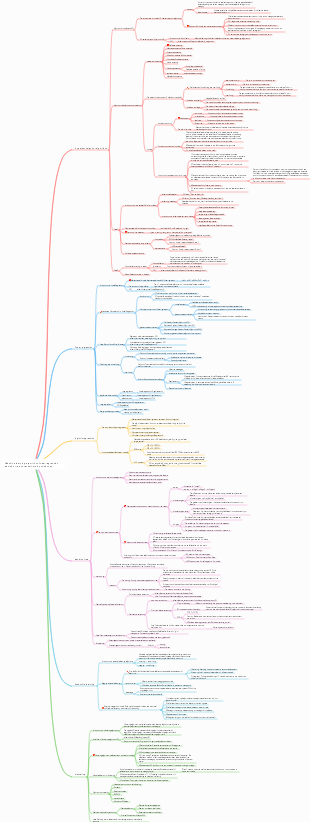
This picture is a mind map of decision tree architecture algorithm programming. One picture will help you fully understand the relevant content and help you improve efficiency. Come and give it a try~
Edited at 2023-02-19 16:58:43- New Employee First - week Onboarding Plan
Mappa mentale per il piano di inserimento dei nuovi dipendenti nella prima settimana. Strutturata per giorni: Giorno 1 – benvenuto, configurazione strumenti, presentazione team. Secondo giorno – formazione su policy aziendali e obiettivi del ruolo. Terzo giorno – affiancamento e primi task guidati. Il quarto giorno – riunioni con dipartimenti chiave e feedback intermedio. Il quinto giorno – revisione settimanale, definizione obiettivi a breve termine e integrazione culturale.
- Analisi del campo di allenamento inglese
Mappa mentale per l’analisi della formazione francese ai Mondiali 2026. Punti chiave: attacco stellare guidato da Mbappé, con triplice minaccia (profondità, taglio, sponda). Criticità: centrocampo poco creativo – la costruzione offensiva dipende dagli attaccanti che arretrano. Difesa solida (Upamecano, Saliba, Koundé). Portiere Maignan. Variabili: gestione infortuni e condizione fisica dei big. Ideale per scout, giornalisti e tifosi.
- Analisi della lineup francese
Mappa mentale per l’analisi della formazione francese ai Mondiali 2026. Punti chiave: attacco stellare guidato da Mbappé, con triplice minaccia (profondità, taglio, sponda). Criticità: centrocampo poco creativo – la costruzione offensiva dipende dagli attaccanti che arretrano. Difesa solida (Upamecano, Saliba, Koundé). Portiere Maignan. Variabili: gestione infortuni e condizione fisica dei big. Ideale per scout, giornalisti e tifosi.
Decision tree architecture algorithm programming mind map
- New Employee First - week Onboarding Plan
Mappa mentale per il piano di inserimento dei nuovi dipendenti nella prima settimana. Strutturata per giorni: Giorno 1 – benvenuto, configurazione strumenti, presentazione team. Secondo giorno – formazione su policy aziendali e obiettivi del ruolo. Terzo giorno – affiancamento e primi task guidati. Il quarto giorno – riunioni con dipartimenti chiave e feedback intermedio. Il quinto giorno – revisione settimanale, definizione obiettivi a breve termine e integrazione culturale.
- Analisi del campo di allenamento inglese
Mappa mentale per l’analisi della formazione francese ai Mondiali 2026. Punti chiave: attacco stellare guidato da Mbappé, con triplice minaccia (profondità, taglio, sponda). Criticità: centrocampo poco creativo – la costruzione offensiva dipende dagli attaccanti che arretrano. Difesa solida (Upamecano, Saliba, Koundé). Portiere Maignan. Variabili: gestione infortuni e condizione fisica dei big. Ideale per scout, giornalisti e tifosi.
- Analisi della lineup francese
Mappa mentale per l’analisi della formazione francese ai Mondiali 2026. Punti chiave: attacco stellare guidato da Mbappé, con triplice minaccia (profondità, taglio, sponda). Criticità: centrocampo poco creativo – la costruzione offensiva dipende dagli attaccanti che arretrano. Difesa solida (Upamecano, Saliba, Koundé). Portiere Maignan. Variabili: gestione infortuni e condizione fisica dei big. Ideale per scout, giornalisti e tifosi.
- Recommended to you
- Outline