 Wondershare EdrawMind
MindMap Gallery Gap Trading Strategy Mind Map
Gap Trading Strategy Mind Map
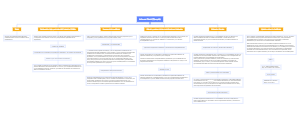
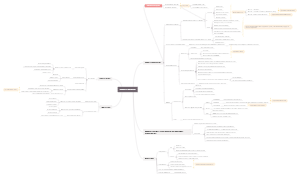
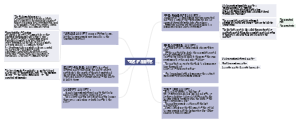
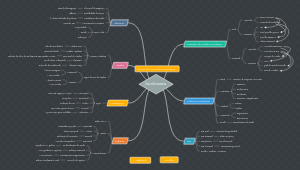
This Gap Trading Strategy Mind Map provides a comprehensive visual framework for understanding price gaps (Gaps) in financial markets and how traders use them to identify high-probability trading opportunities. Designed for stock traders, forex traders, futures investors, cryptocurrency traders, technical analysts, and price action practitioners, the template explains the relationship between price gaps, supply and demand imbalances, market psychology, support and resistance zones, and structured trading development. The mind map is organized around the central concept of GAPS and expands into several essential learning modules, including What Is a Gap, When Gaps Occur, Gap Risk, Gap Trading Opportunities, Types of Gap Structures, How to Identify Demand Zones (DZ) and Supply Zones (SZ), and a structured 90-Day Trading Development Plan. Together, these sections help traders build a disciplined and repeatable trading methodology. The template explains that price gaps represent significant imbalances between supply and demand, where price moves rapidly without continuous trading activity, leaving an empty area on the chart. Such gaps often occur after major news events, strong buying or selling pressure, earnings announcements, market openings, or periods of heightened volatility, making them valuable indicators of institutional activity and market sentiment. One major section distinguishes between Novice Gaps and Professional Gaps. Novice gaps are generally driven by emotional retail trading and frequently appear during strong trend continuation. Professional gaps, on the other hand, often reflect institutional buying or selling activity, creating significant supply and demand imbalances that may offer higher-probability trading opportunities. The template discusses how different gap structures behave under trending and counter-trend market conditions.
Edited at 2026-06-10 12:43:10
- Recommended to you
- Outline