How to Create a Fishbone Diagram in Excel
Create Your Fishbone Diagram NowFishbone diagrams are frequently used in enterprises and companies arranging meetings where this diagram is used to identify the entirety of the segments. Both machine and human errors are identified in any work process with this. When these parts are recognized, it's significantly simpler to take a look at everything and see where problems are. While there is some committed effort by the number of software and applications that help develop the fishbone diagram excel, you can likewise create these visual guides yourself.
Making a fishbone diagram in Excel can be confusing if you are new to it because Excel's primary role is dissecting information, not creating visual documentation. So, let us see how to make one in excel.

1. What is A Fishbone Diagram?
Fishbone diagrams outline all the errors and causes that can add to a potential effect on the system or your work. Commonly, the effect is a problem; causes are recorded and sorted to help venture managers forestall the issue.
This fishbone diagram excel is alluded to as a fishbone because it's shaped like one. The effect, or problem, is the fish's head, while causes and classes make up the body. The standard classes for causes are Methods, Materials, People, Measurements, Machine, and Environment. It may be contingent upon what your diagram represents; you can incorporate different aspects in this diagram.
2. How to Create Fishbone Diagram in Excel?
Step 1
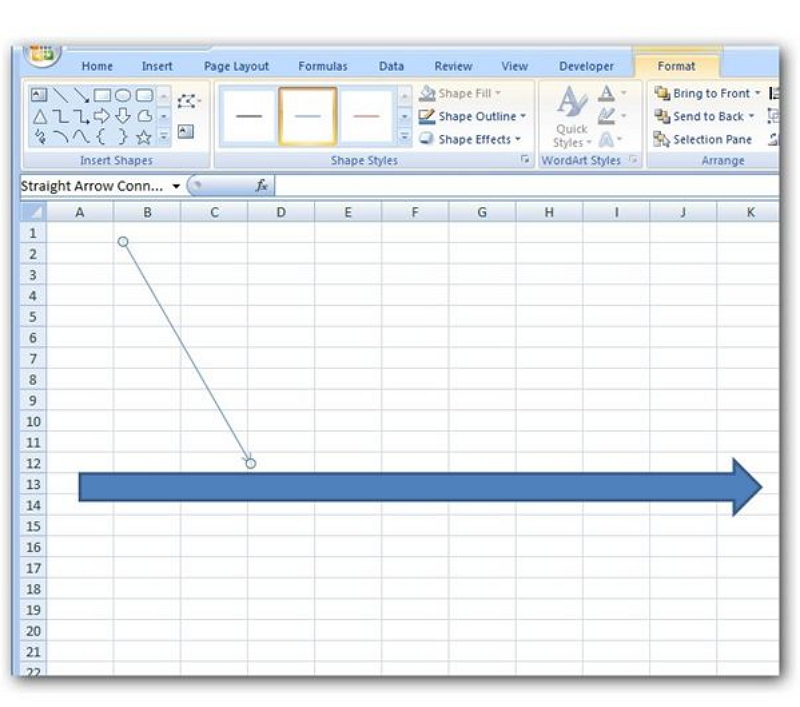
We'll start by building the first bars in the center of the fishbone diagram excel. Go to the Insert tab on the Excel home and click on Shapes. After that, click on the principal bolt in the Block Arrows class. Or on the other hand, you can pick any of the different bolt shapes on the off chance that you like.
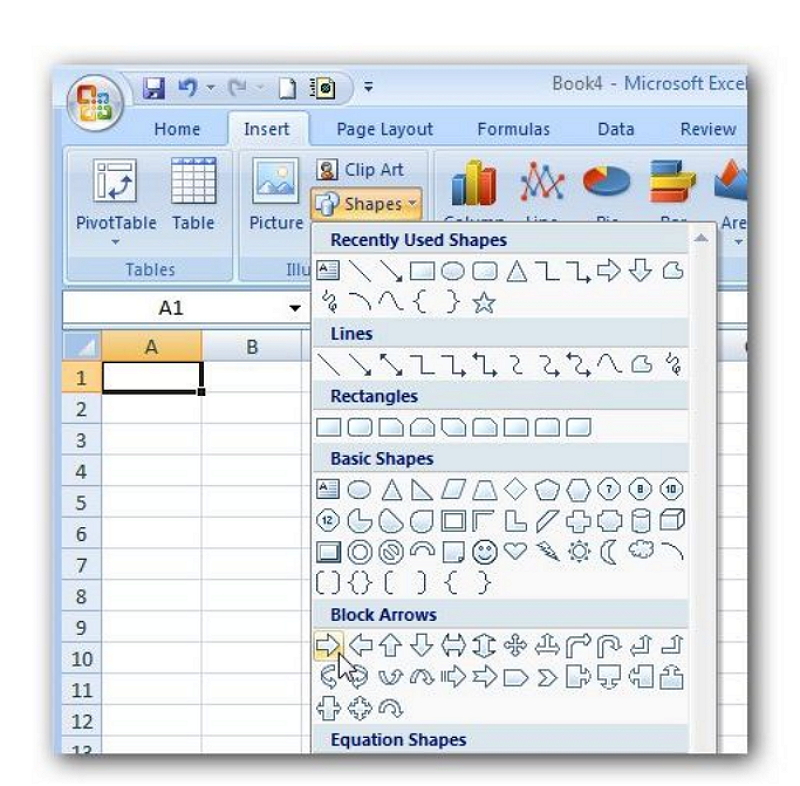
Source: Microsoft Excel
Touch any place in the spreadsheet, and the bar will be put. When the bar has been set, you can move and resize it to the area and shape you like. Here, we'll make the bolt more and spot it in the noticeable spreadsheet zone.
[caption id="align="aligncenter" width="600"]
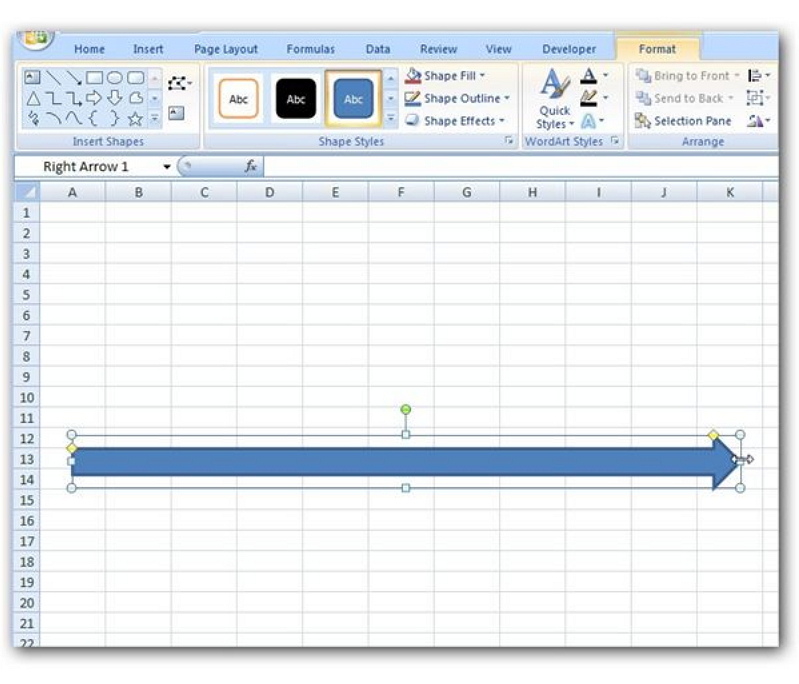
Source: Microsoft Excel
Step 2
Presently, we need to secure the lines that merge into the system bar. Come back to the Insert tab on the Excel home tab and click on Shapes once more. This time select the single-headed bar (the subsequent thing) in the Lines class.
[caption id="align="aligncenter" width="600"]
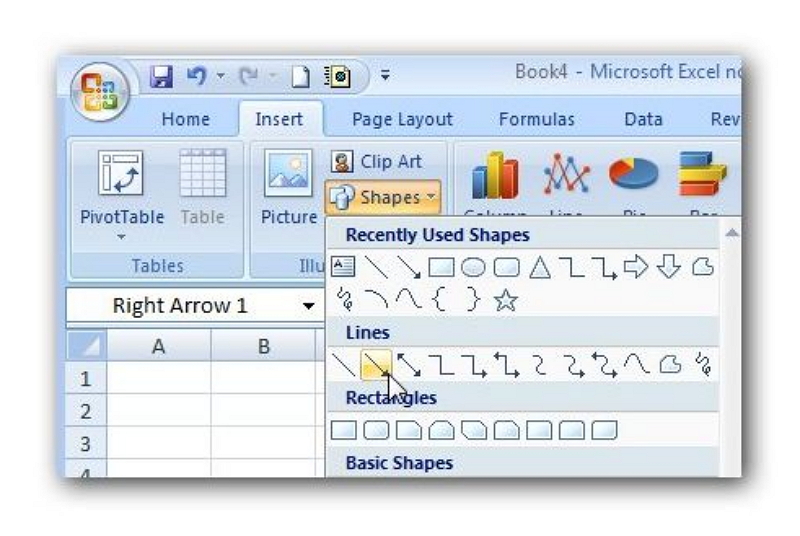
Source: Microsoft Excel
Snap somewhere on the spreadsheet to embed the line. Try not to stress a lot over the situation since we're going to need to move it at any rate after we resize it. Snap and drag one of the endpoints of the line to resize and change the point of the item. The screen captures underneath shows this activity in the process.
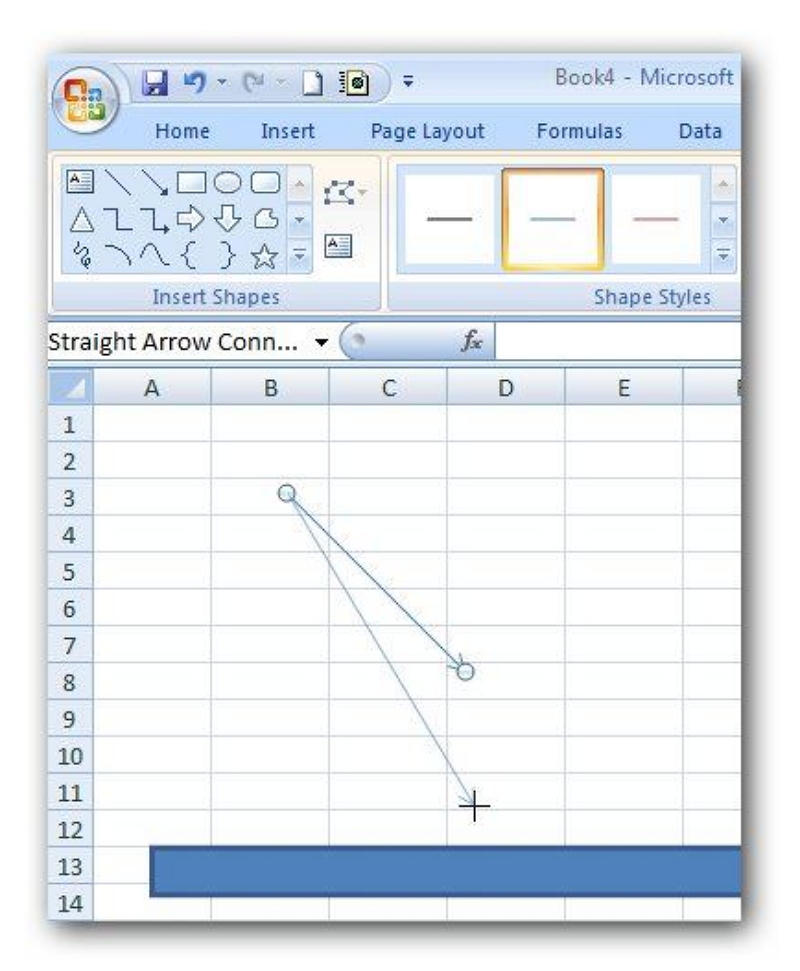
Source: Microsoft Excel
Next, drag the line to the ideal place on the spreadsheet. Your diagram should look something like this.
Source: Microsoft Excel
Step 3
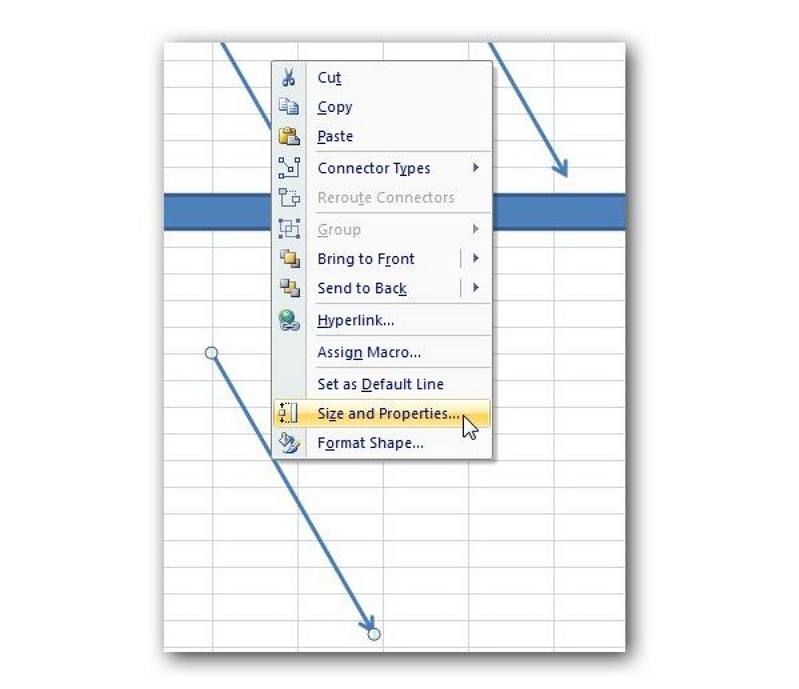
Presently, we need to embed extra lines, but instead, and then perform Step 2 for each line we need to include; we'll use an alternate route. Right-click on the current line and select Copy. At that point, right-click on some other territory in the spreadsheet and choose Paste.
This step is the same thing we did in step 2, follow those instructions, and made the lines accordingly the fish structure you want. Just click the right button of your mouse pad and click on the size and properties.
Source: Microsoft Excel
Step 4
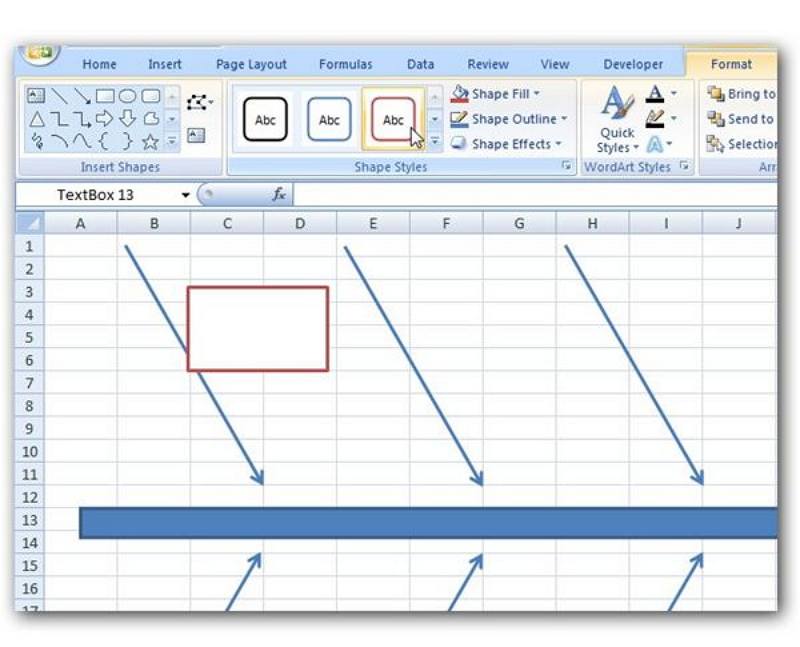
This step all you need to do is to put a text box and go to the insert tab on the excel home tab and click on the Text Box. Click on the spot in the spreadsheet where you need to set the content box. Snap and drag any of the sides of the content box to resize it to your ideal size and shape.
Source: Microsoft Excel
Step 5
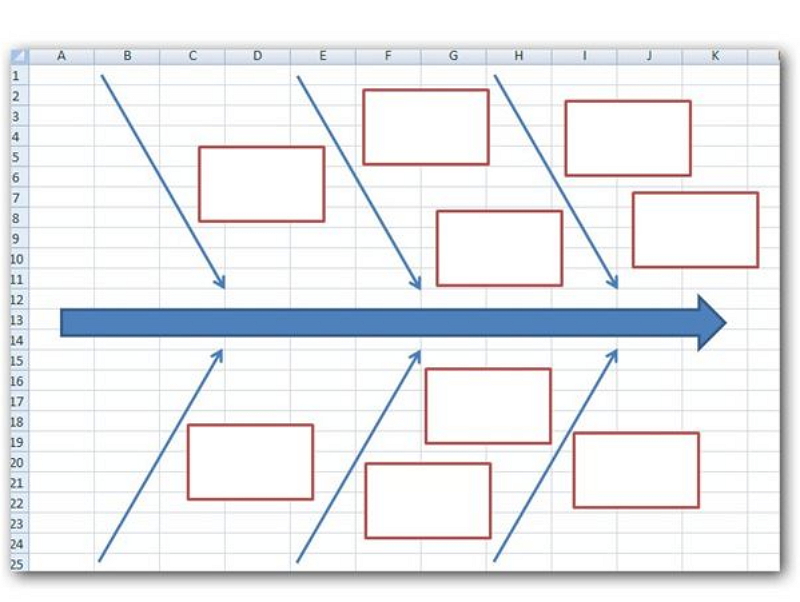
Similarly, with the lines we added to the fishbone diagram excel, the least demanding approach to add more content boxes is to reorder the one created in Step 4. You can choose each new content box and drag them to another situation on the spreadsheet in any way.
Source: Microsoft Excel
3. More Easier Way to Create A Fishbone Diagram
As mentioned steps above, a user who is new to making diagrams in a spreadsheet might get overwhelmed, confused, and unable to follow all those steps.
To make it easier for people like that or for people who are too busy to sit and make a fishbone diagram excel from scratch. To make it easier, one can use EdrawMind to create a fishbone diagram with just a click on their hand, since EdrawMind has a lot of predefined templates, making it even easier to access it. Just choose a template, add your information, or make it from scratch to a more user-friendly way. Just follow the step below.
Step 1
Open EdrawMind desktop or online version.
Right off the bat, open the Mind Master from your desire place. You will see various options under the Available Templates, both paid and free and templates under Local Examples. For this instructional exercise, we will choose the fishbone template. You can pick a premade template from underneath or click on the fishbone to get a clear page to begin making a brain map without any preparation.
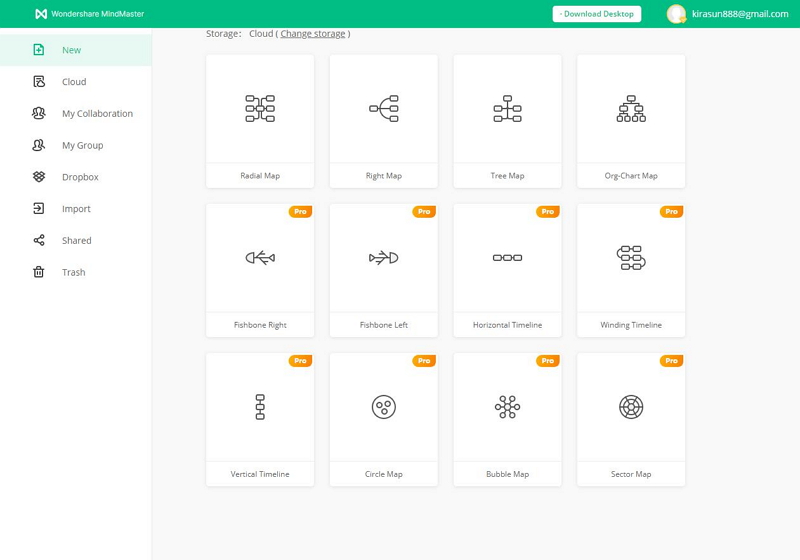
Source: EdrawMind
Step 2
Create your fishbone diagram in EdrawMind.
To draw a fishbone diagram excel without any preparation; use the instruments in Home Tab in Mind Masterwork area application. To draft a psyche map, click on Topic for the principle point, include subtopics or drifting subjects, and lastly include branches utilizing the Relationship alternative. Additionally, continue changing or adding more components until your brain map is finished. At last, enter text in your fishbone diagram.
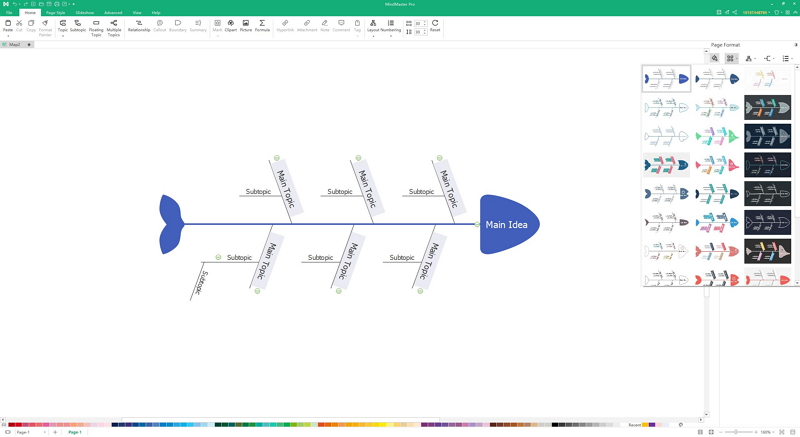
Source: EdrawMind
Step 3
Export your fishbone diagram in multiple formats.
Keep editing until you are satisfied, then export your fishbone diagrams in multiple formats, including Graphics, PDF, HTML, Microsoft Office, PS, Visio, etc. Therefore, it will be far more convenient to export the fishbone diagram in jpg or png format, then attached to the excel, presentation, or report.
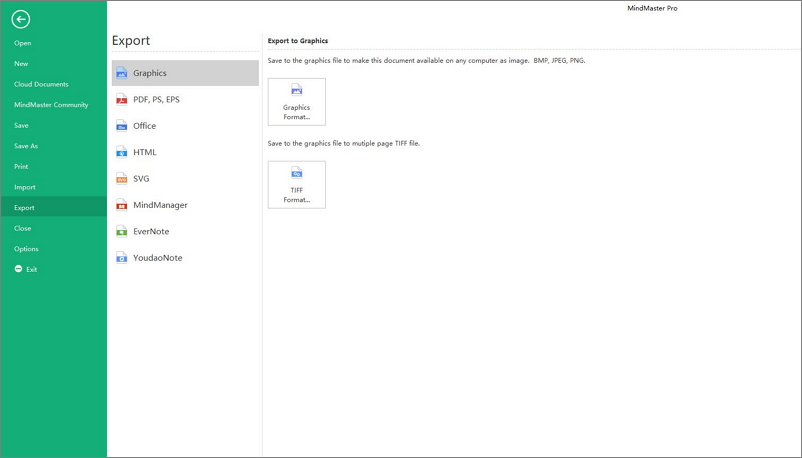
Source: EdrawMind
4. Conclusion
EdrawMind is a superb application for making mind maps and different kinds of diagrams. It is effectively accessible for various stages like Web, Desktop, and Mobile. Even more, if you are an avid user of this diagram in your work, making it from scratch may take more of the time, which one can use to relax or complete deadlines. Using EdrawMind to create a fishbone diagram could be much easier than making the fishbone diagram in excel.