How to Draw a Fishbone Diagram
Discover More Helpful Information!
Welcome to EdrawMind!![]() Unleash your creativity and enhance productivity with our intuitive mind mapping software.
Unleash your creativity and enhance productivity with our intuitive mind mapping software.

Fishbone diagrams (commonly known as Ishikawa diagrams, herringbone diagrams, cause-and-effect diagrams) is a diagram used to identify the cause of an effect or a problem. Its name is derived from its fishbone shape, with the problem at the head of the diagram, and its causes along the spine of the ‘fish’.
So when are fishbone diagrams most commonly used?
- Identifying the root cause of a problem
- Identifying why parts of a process aren’t working
- Conducting a mult-variable analysis of a problem
For a more detailed look at fishbone diagrams, check out our article What is a Fishbone Diagram.
To effectively create a fishbone diagram, split the process into two parts: the planning phase, and the drawing phase.
Planning Phase
1. Identify the problem. Is there a recurring problem you and your team are facing? Once you have identified this, it will be placed at the ‘head’ of the diagram.
2. Categorize the causes. Typically, these are Equipment, Process, People, Materials, Environment, and Management. These categories will run along the ‘body’ of the diagram.
3. Why? Brainstorm the causes of a problem. At the same time, keep asking "why does this happen?" about each cause. Each causal factor can have its own branch and sub-branches.
4. By continuously questioning and analysing the causes, you will soon get to the root of the problem. This will help you understand why the problem exists, and what steps you can take to prevent the problem from arising in the future.
Creating Phase
Using EdrawMind, you can create a fishbone diagram in a matter of minutes. Follow these simple steps:

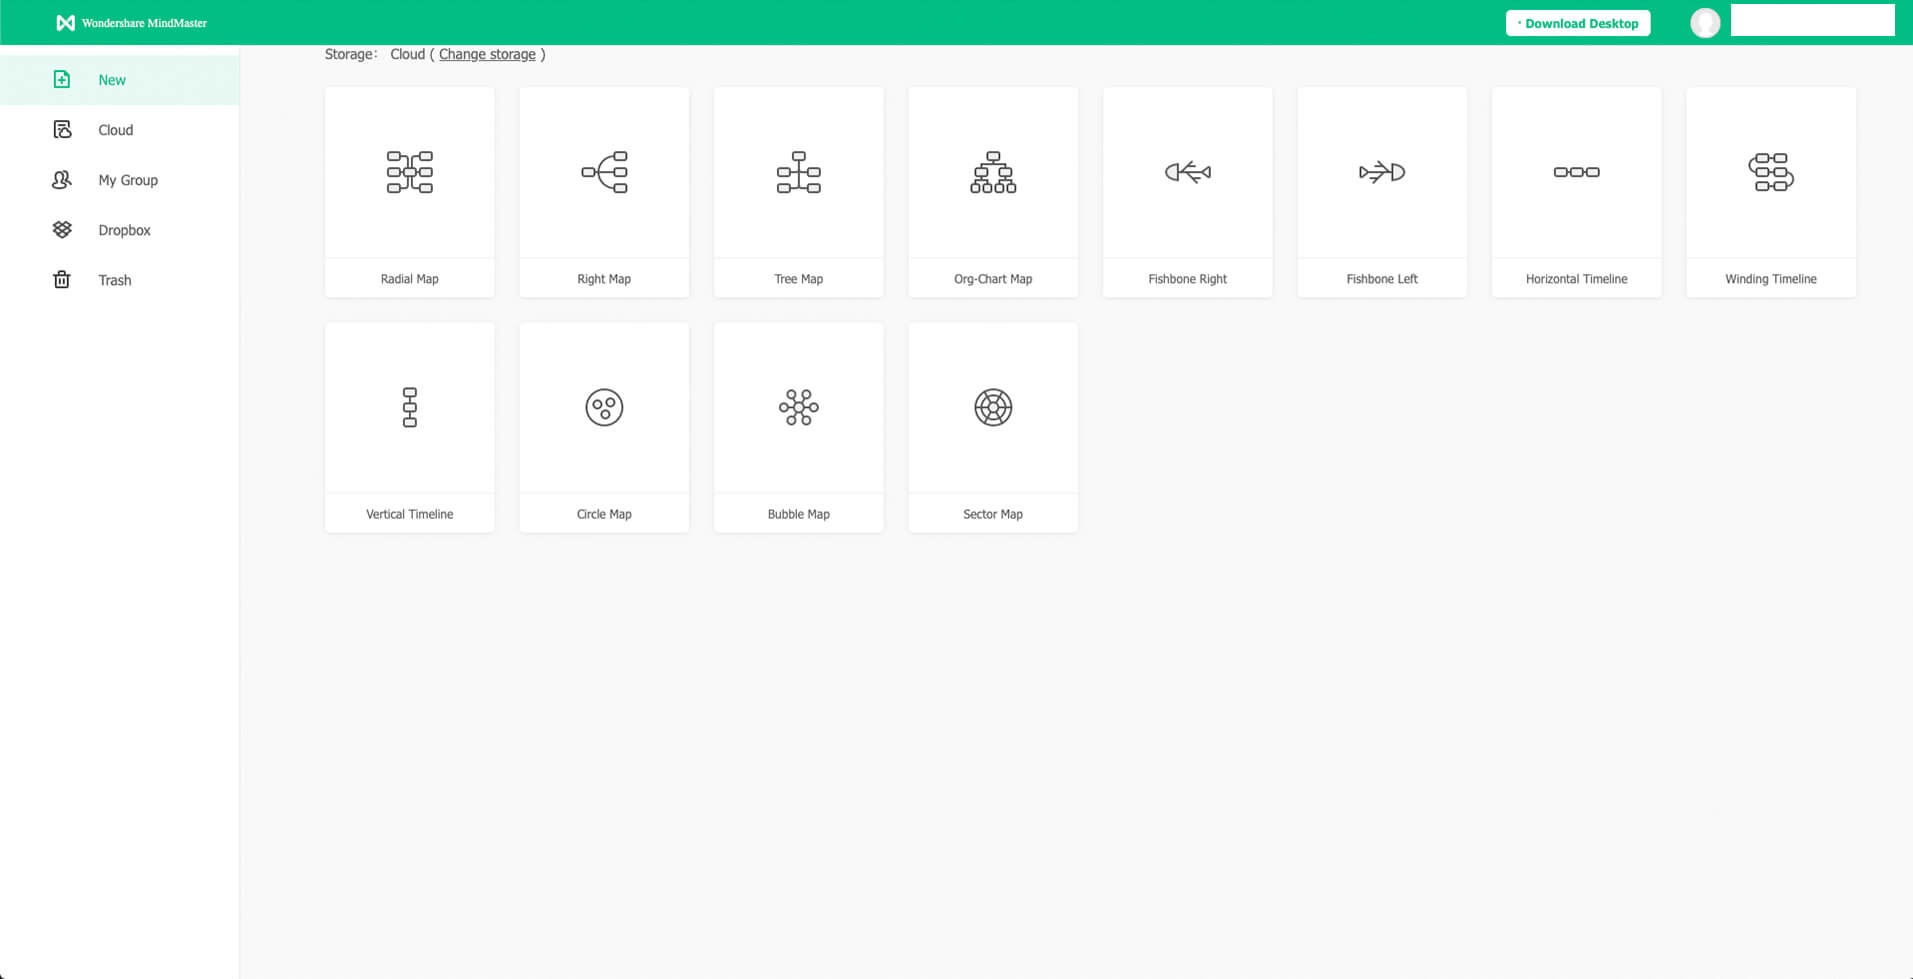
1. Register and log in to EdrawMind. On the dashboard, you will see various diagrams that you can create with the program.
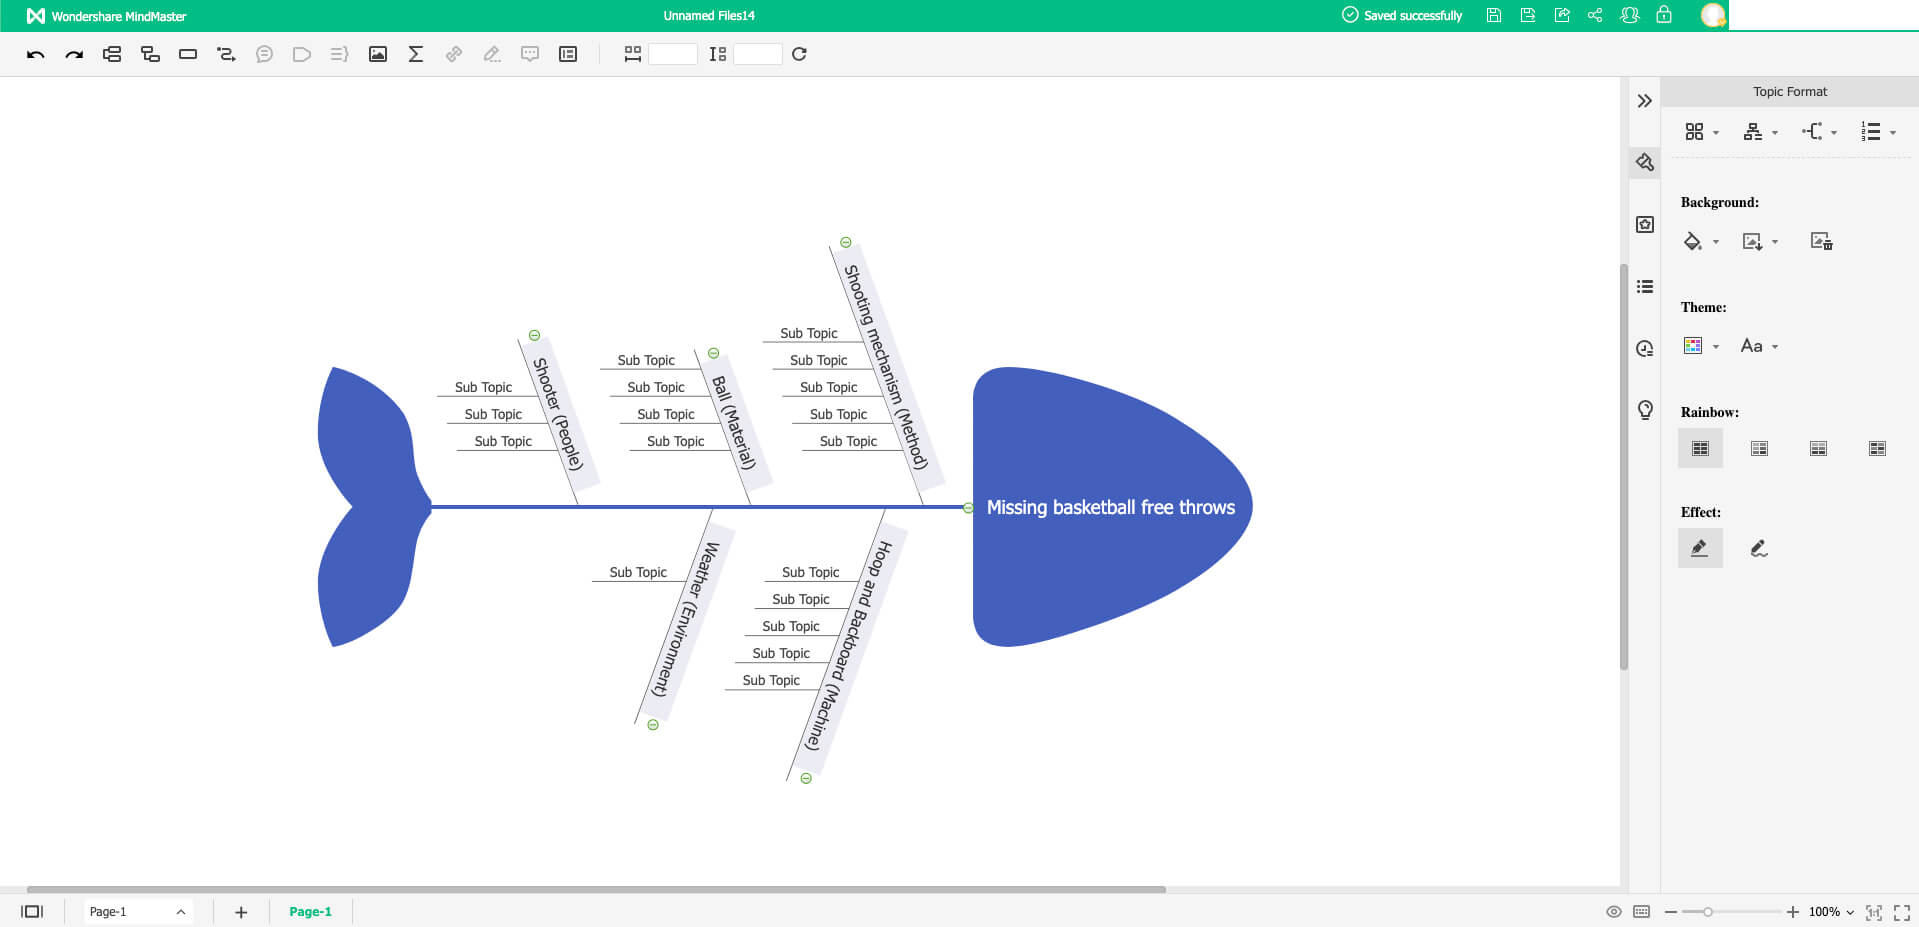
2. Click on the "Fishbone Left" diagram. The head, body and tail of the diagram will appear as the default interface.
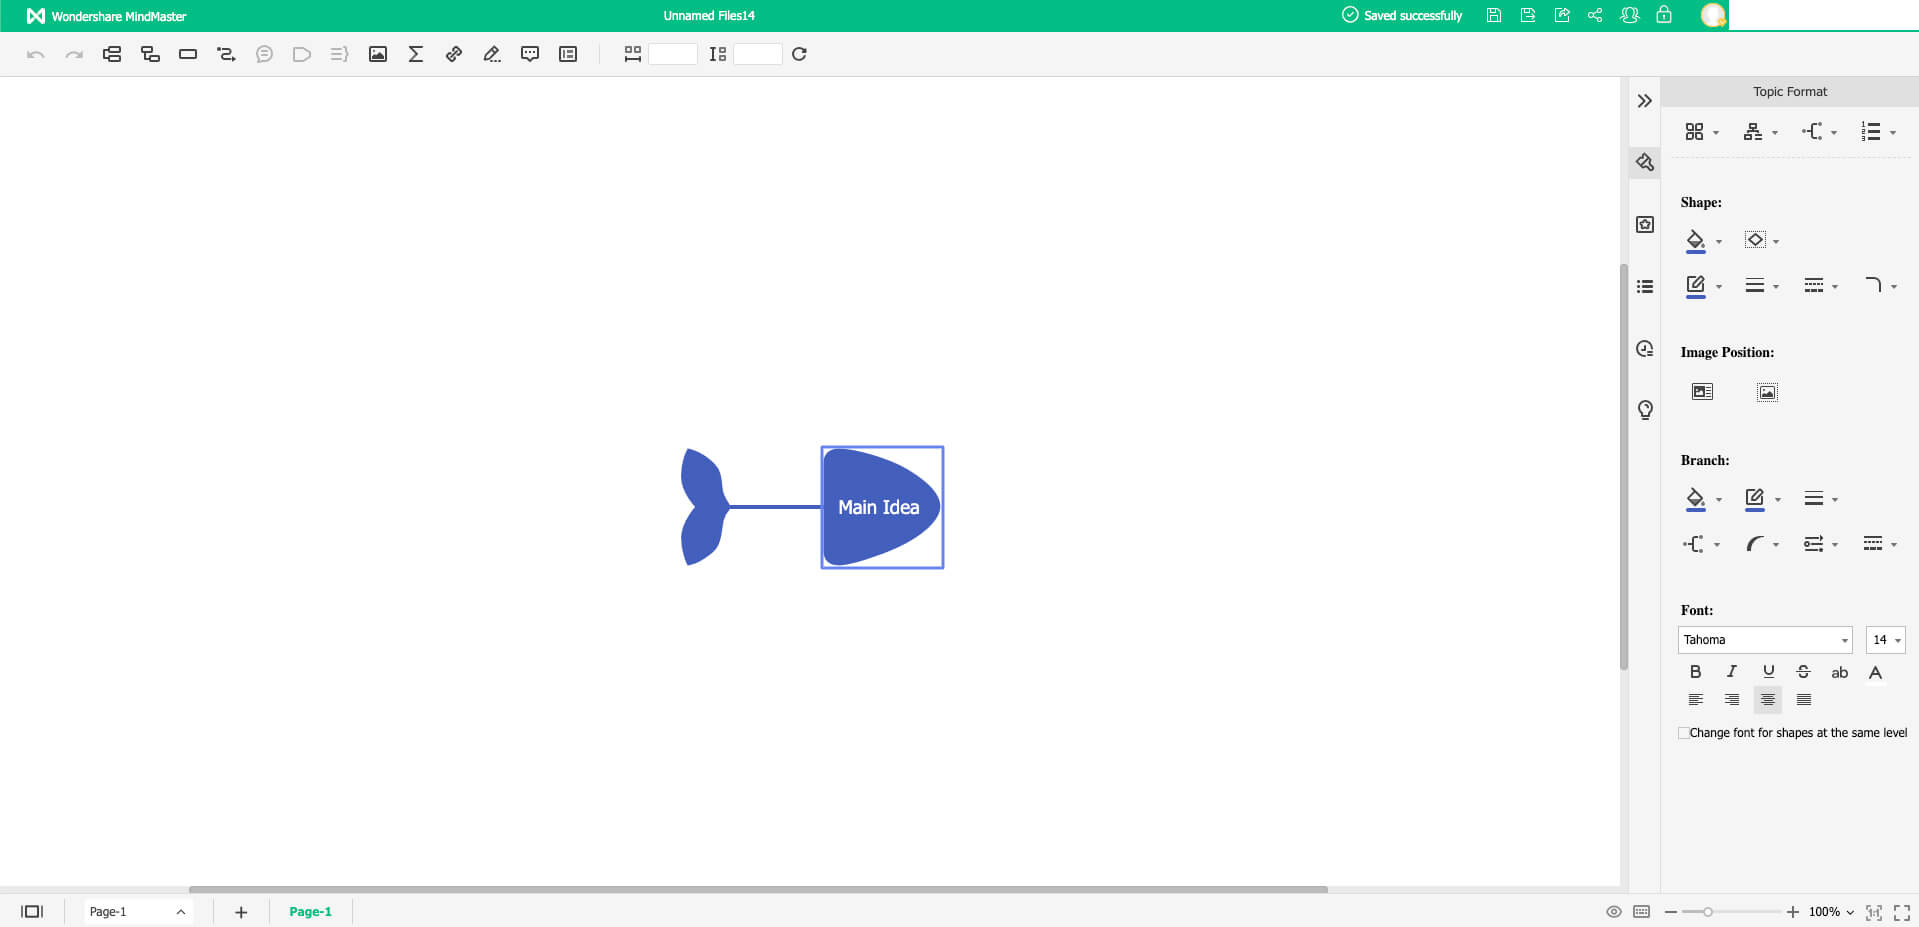
3. Start by putting the problem at the head of the fish.
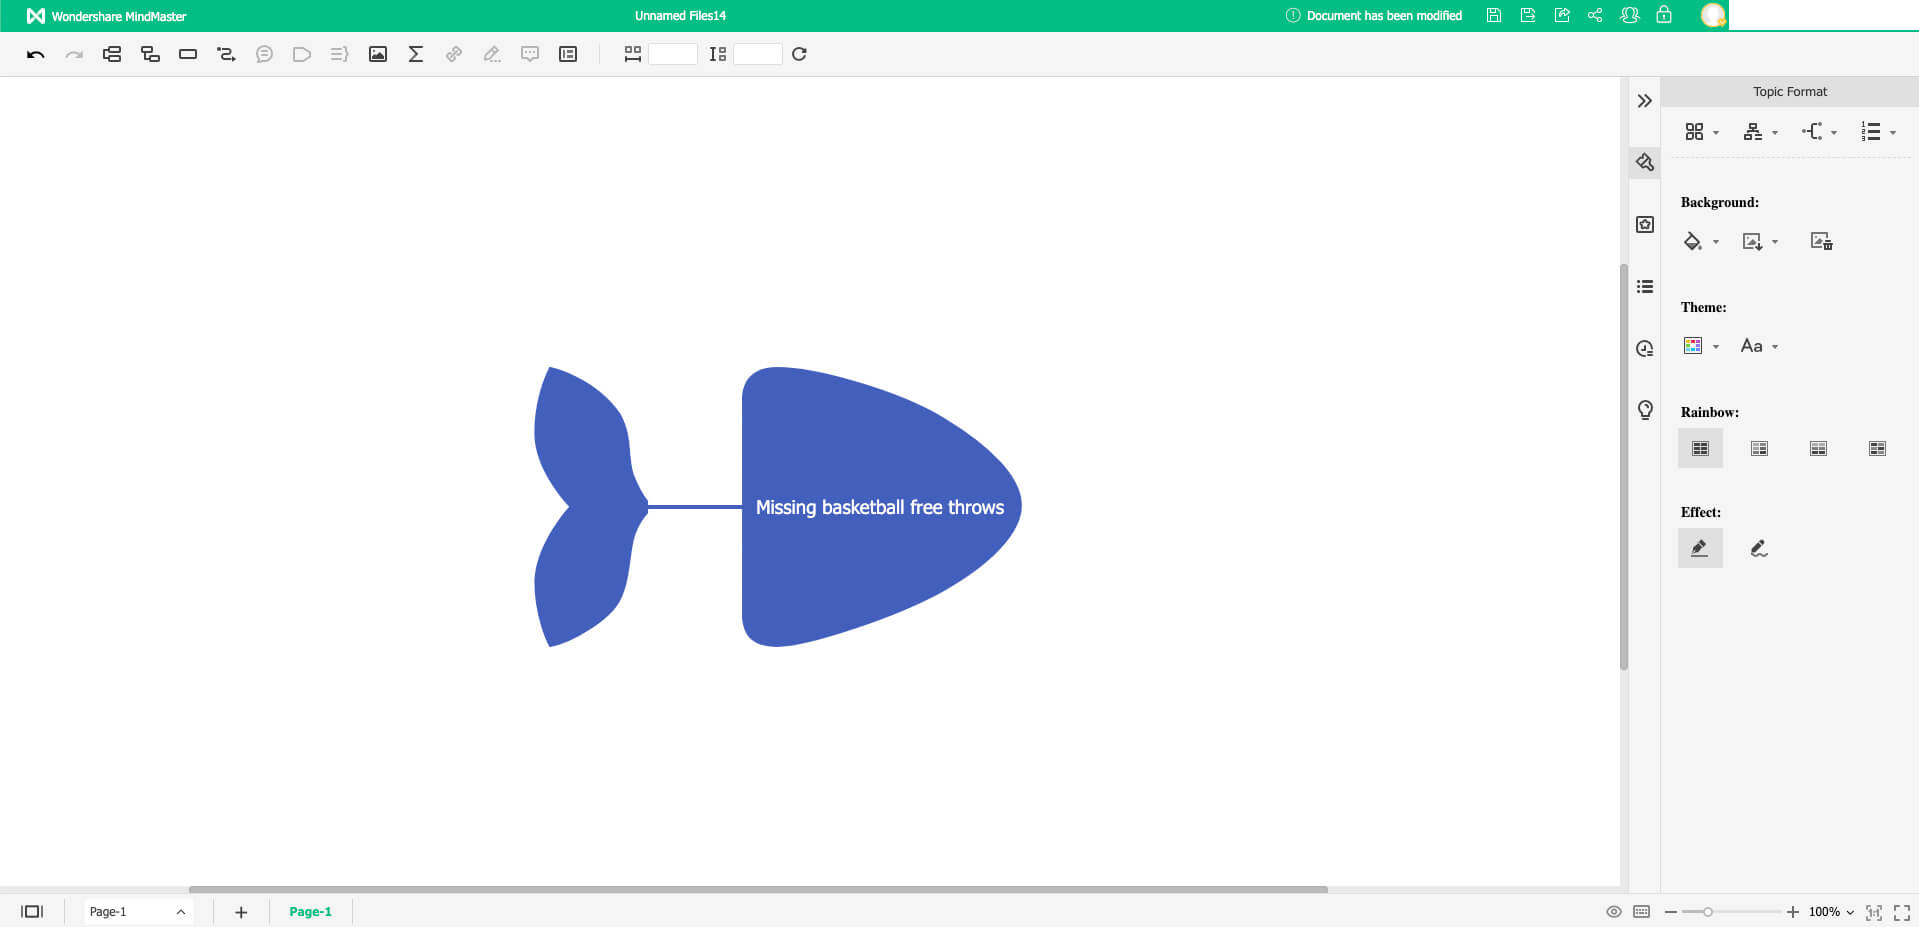
4. To add causes, click on "Insert Topic" on the top toolbar.
5. To add sub-causes, hover your mouse at the tip of the cause branch until you see a blue "+" symbol. Click on "+" to add as many sub-causes as you need.
6. And there you have it! Once you have filled in all of the branches, you have created your very own fishbone diagram.
Creating fishbone diagrams on EdrawMind is incredibly intuitive. Here are 3 fishbone diagram examples made on EdrawMind.
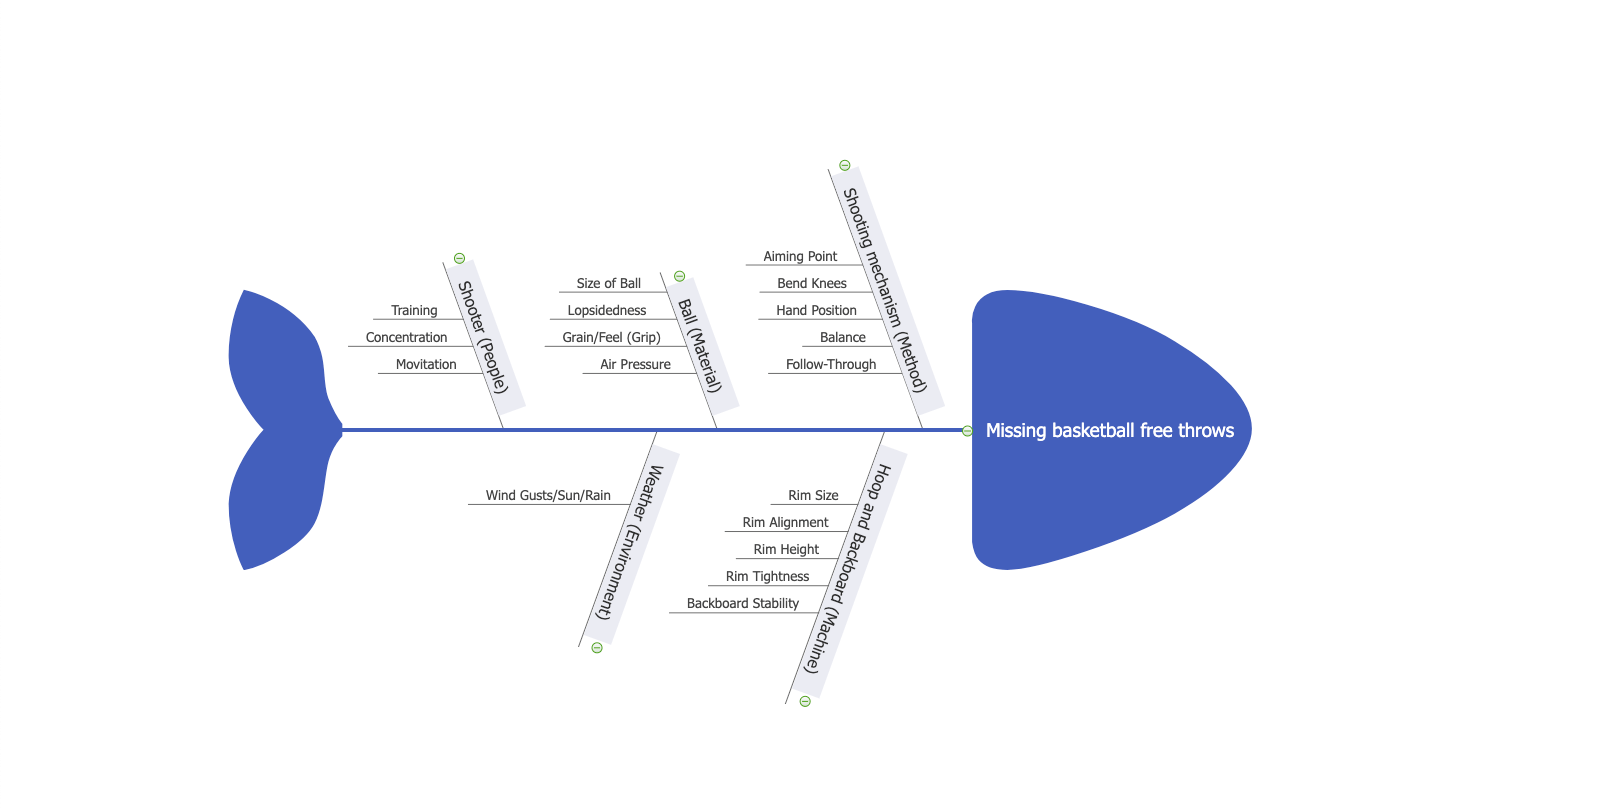
Image 1: Missing basketball free throws. Basketball is an incredibly popular sport, and free throws are an integral part of it. This fishbone diagram breaks down the many possible factors that might cause an athlete to miss them.
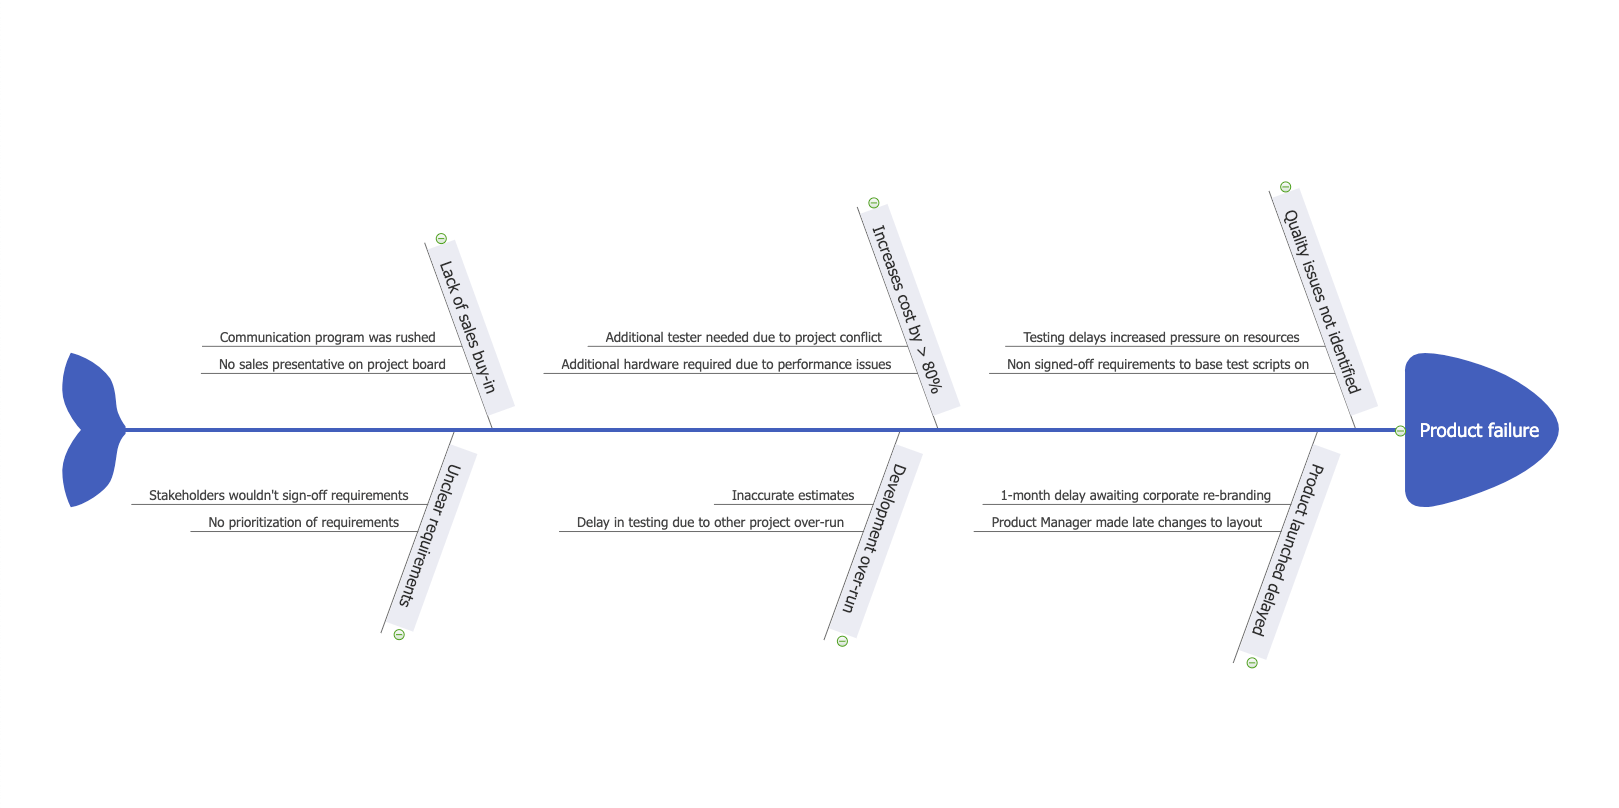
Image 2: Analysing a product failure. This diagram explores the many factors that might have led to product failure, including systemic failures, human error, and a lack of planning.
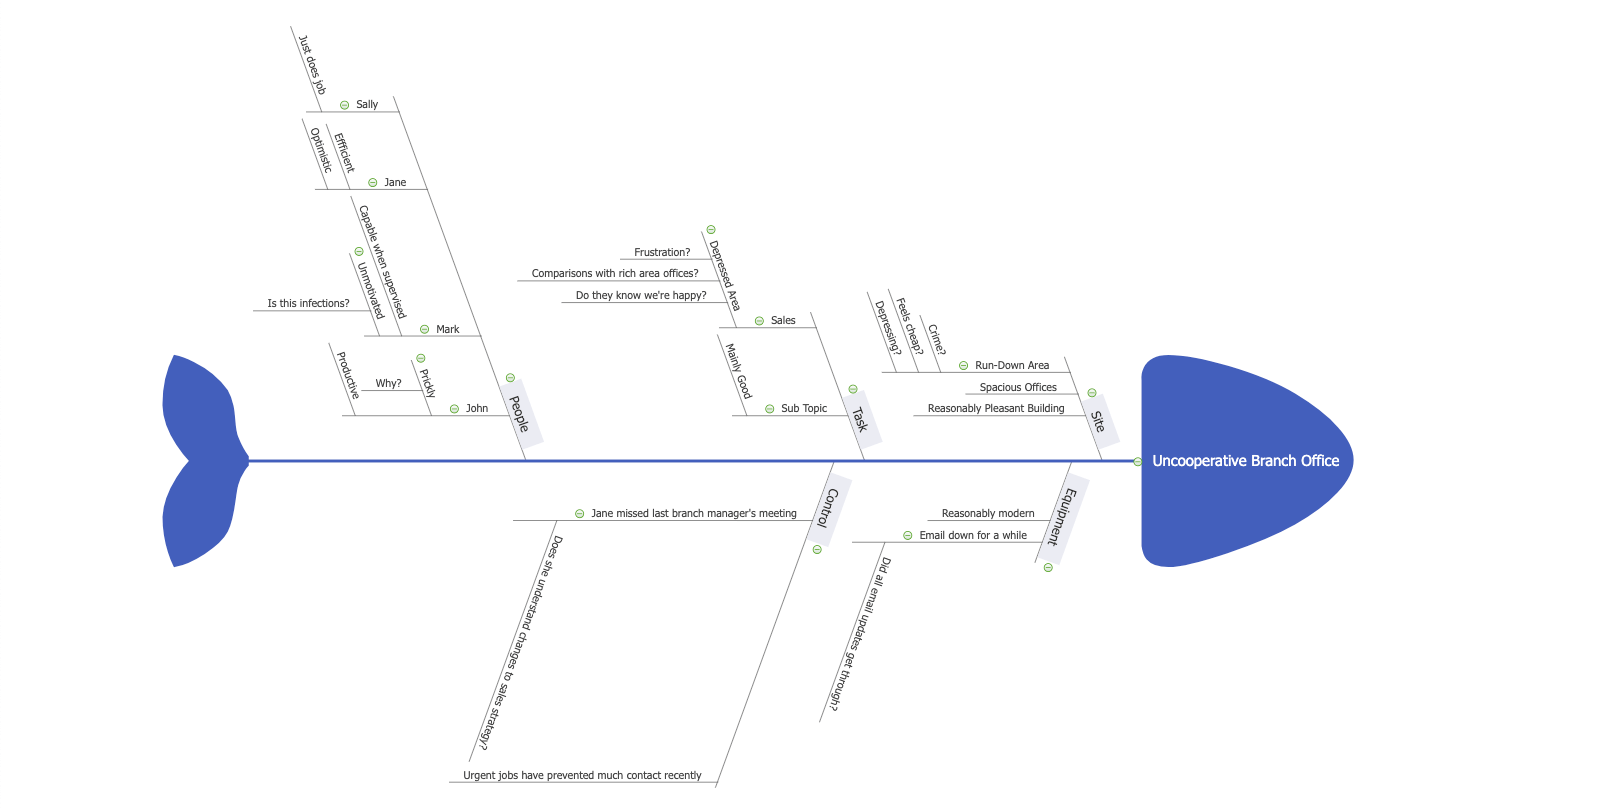
Image 3: Uncooperative Branch Office. An office can be an incredibly dynamic place, but can be extremely problematic when things go awry. This fishbone diagram explores the many factors that can cause workplace relationships and productivity to take a hit.
Whether it be school, work or in our personal lives, we all experience problems that we need solving. However, complex problems require a multivariable analysis. Fishbone diagrams allow you to tear apart a problem and truly understand why it happens. Follow this guide, study our fishbone diagram examples, and try out EdrawMind now to start creating your own diagrams!