What is a Flowchart: Explained with Examples & Templates
Edraw Content Team
Do You Want to draw a flowchart?
EdrawMind helps move ideas forward, faster and better. Learn from this article to know everything about flowchart. Just try it free now!
1. What is a Flowchart?
A flowchart outlines different steps in a process and depicts a system or computer algorithm. It is also known as a process flowchart and process flow diagram as it describes the flow in a system. It has its variations such as:
- Detailed Flowchart: It is also called process map, service map, symbolic flowchart, or micro map.
- Deployment Flowchart: It is also called down-across or cross-functional flowchart.
- Macro Flowchart
- Several-leveled Flowchart
- Top-Down Flowchart
A flowchart is a process analysis tool employed in many processes, such as service processes, administrative processes, project plans, or manufacturing processes. The utilization of flowcharts dates back to the early 20th century. In 1921, Frank and Lillian Gilbreth introduced the "Flow Process Chart" to the American Society of Mechanical Engineers (ASME). In the 1930s and 1940s, other engineers used Gilbreth's tools to make work more efficient for business people. In 1947, ASME adopted a symbol system derived from Gilbreth's original work.
The popularity of flowcharts is because they make communication of plans easier for their users. They help you analyze a process from start to finish in a sequential order without any confusion. In this way, you can remember crucial steps covering critical procedures, inputs, and outputs.
2. Common Flowchart Symbols
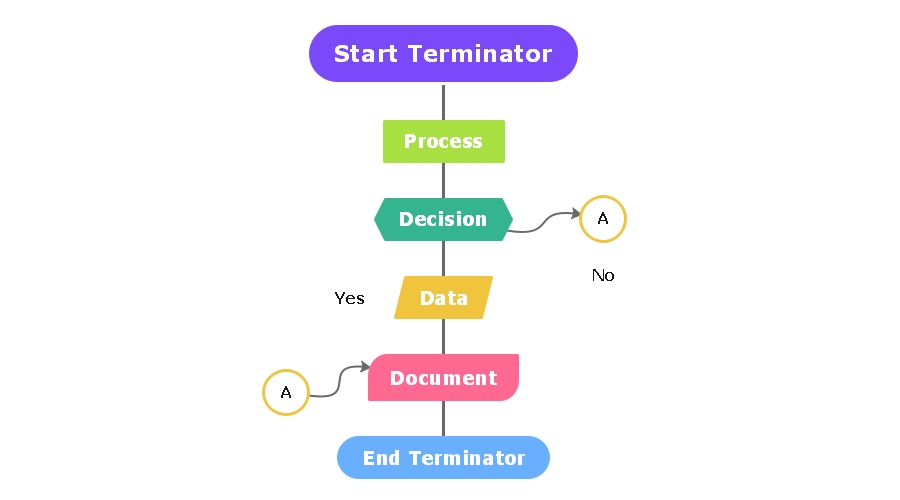
Different flowchart symbols have different meanings and utility. The most common symbols are:
- Terminator: It is an oval flowchart shape that indicates the start or end of the process.
- Process: It is a rectangular shape indicating a regular process flow step.
- Decision: It is a diamond flowchart shape that indicates a branch in the process flow.
- Connector: A small, labeled, circular flow chart shape indicates a jump in the process flow.
- Data: It is a parallelogram indicating data input or output for a process.
- Document: It indicates a report or paper.
3. Types of Flowcharts
The following are different types of flowcharts:
From the Perspective of Different User Groups
From the perspective of different user groups such as managers, clerks, and system analysts, there are four general types of flowcharts.
Document Flowcharts
These flowcharts show controls over a document flow through a system.
Data Flowcharts
These flowcharts show control over data flow in a system.
System Flowcharts
These flowcharts show controls at a physical or resource level.
Program Flowchart
These charts show controls in a program within a system.
From a Business Perspective
The flowcharts used in businesses are of the following types based on the process you are aiming to visualize:
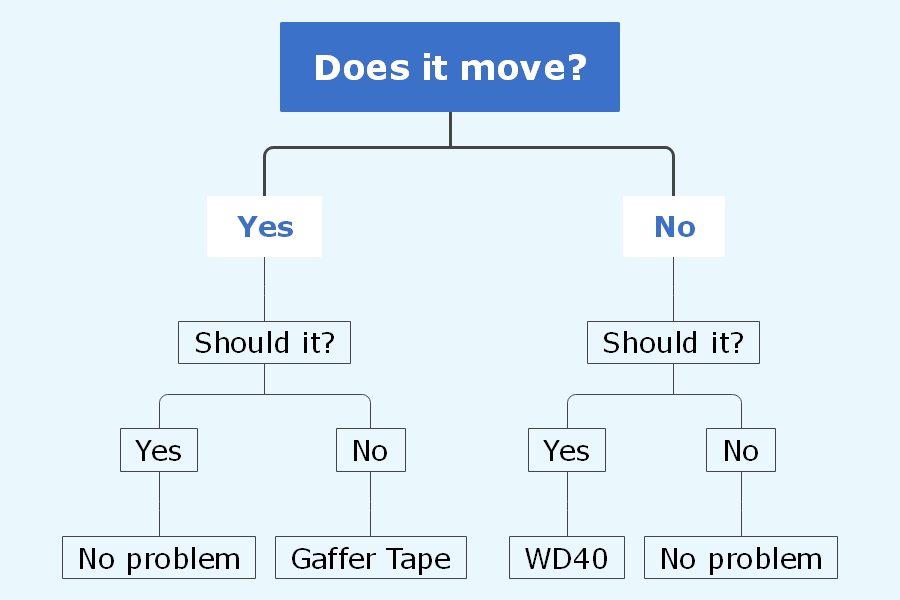
Decision Flowchart
This flowchart explains the steps taken to justify a decision. It is beneficial in predicting the consequences of a decision.
System Flowchart
It represents the flow of data in a system, especially accounting.
Logic Flowchart
It is applied to uncover bottlenecks, loopholes, or constraints from the process which might cause issues or disruptions.
Process Flowchart
This flowchart displays how a particular process will achieve its objectives.
Product Flowchart
It visualizes the process of product creation as well as the sequential order. This type of flowchart assists in documentation when you are launching a new product.
Andrew Veronis Flowchart
Andrew Veronis published a book called Microprocessors: Design and Application in 1987, which describes the following three types of flowcharts:
System Flowchart
Detailed Flowchart
General Flowchart
Other Common Flowcharts
There are several types of flowcharts that are commonly used for many purposes. These include:
Data Flow Diagram (DFD)
Business Process Model and Notation (BPMN 2.0)
Workflow Flowchart
PERT Chart
Swimlane Diagram
Event-Driven Process Chain Flowchart (EPC)
Specification and Description Language Flowchart (SDL)
4. How to Use Flowcharts in Your Field?
Flowcharts are used in many fields and professions due to their utility and dynamic functionality.
1 In any Field
Generally, flowcharts can be used in any field to accomplish the following objectives:
- To analyze and document a process.
- To communicate a process for understanding or training different parts of an organization.
- To identify redundancies, bottlenecks, and non-essential steps in a system or process and improve it.
- To standardize the quality and efficiency of a process.
2 In Computer Programming
(For Win)
(For Mac)
(For Linux)
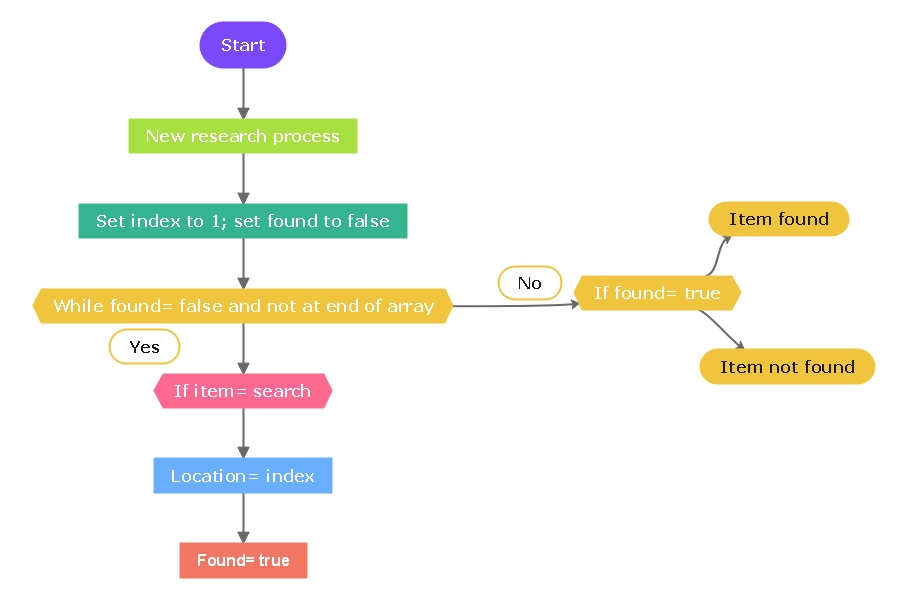
You can write an algorithm or a program by using a flowchart. It can help you organize the thought process involved in understanding the bigger picture and making necessary decisions. This flowchart indicates the process involved in commuter programming or algorithms. It represents various steps that constitute the programming process. Each step is mentioned in a sequential order which ensures the precise and stable flow of the process. This flowchart helps understand how the process works and gives an explicit picture of a program in detail.
3 In Education
(For Win)
(For Mac)
(For Linux)
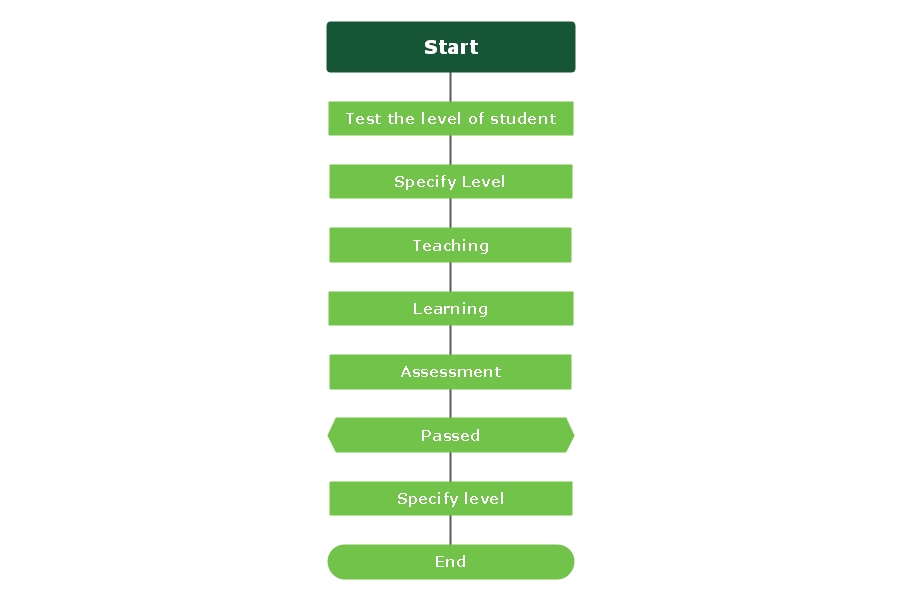
Flowcharts are used for planning coursework and understanding scientific processes. They are also beneficial in communicating hypotheses and theories, demonstrating character development for literature and film, etc. This flowchart indicates the process involved in student admission at a particular level in an educational institution. It starts with testing the student's story with essential knowledge, which leads to specifying a class for that student. The student is then exposed to different sub-processes, and at the end, an assessment is made to see if the student qualifies for the next level.
4 In Marketing
(For Win)
(For Mac)
(For Linux)
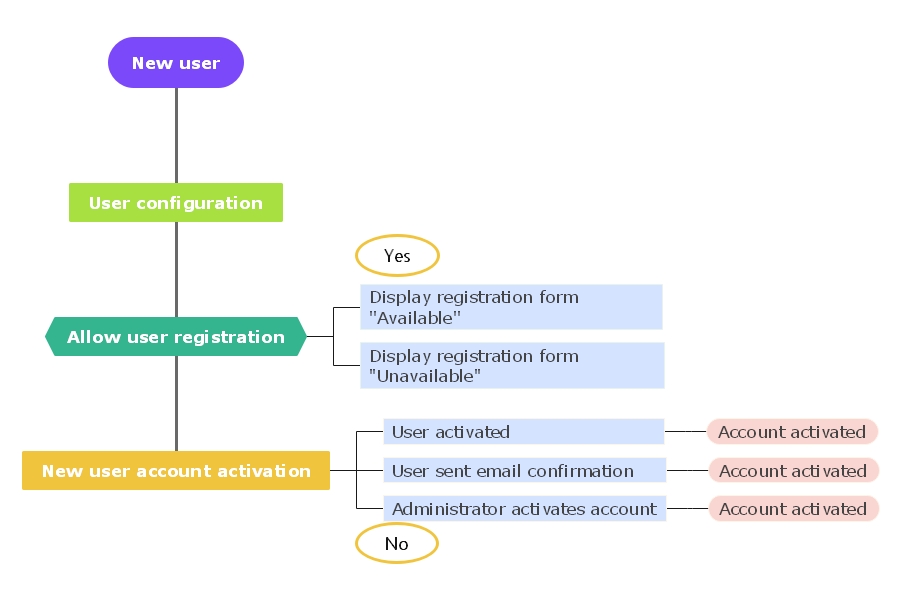
In marketing, flowcharts are used to plan research strategies, plot out the flow of surveys, and chart a sales process.This flowchart indicates the process involved in registering users and their account activation. The registration flow starts with the user configuration of a new user. If the user can register, then the registration form is displayed on the website. The activation of the user account is further divided into different steps based on the strategy involved in the process. Marketers typically follow this flowchart for planning registration flow.
5 In Business
(For Win)
(For Mac)
(For Linux)
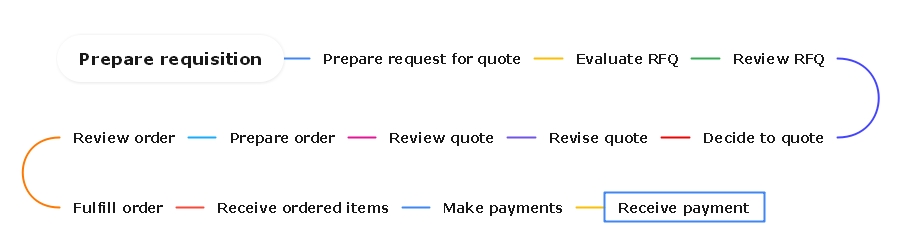
Flowcharts are used to understand the procurement processes, represent an employee's tasks, develop a business plan, document a method, etc.This flowchart indicates various steps involved in a business. It describes the role of the shipping officer, buying agent, management, vendor, and receiving agent in fulfilling an order. The first step in the flowchart is preparing inquisition, which leads to other steps. These steps involve preparing the request for a quote, approval of the requests for quotes, revision, review of the quote, acceptance of the quote, preparation of the order, acceptance of the order, fulfillment of an order, and finally, the making of payment and its reception.
6 In Engineering
(For Win)
(For Mac)
(For Linux)
In engineering, a flowchart is used to design and update the processes, represent process flows, assess the life cycles of a structure, etc.This flowchart indicates the assessment of a process involved in an engineering problem and the evaluation of the way to fix it. This step-by-step analysis and evaluation of a process help think of the best solution for a particular engineering problem.
5. How to Plan and Draw a Basic Flowchart?
The following five steps are involved in planning and drawing a basic flowchart:
1 Define Your Purpose and Scope
Knowing what you want to accomplish is the first step in planning and drawing a flowchart. Please do your research to define the purpose and scope of your work, and use simple communication methods to deliver it to the audience.
2 Identify the Tasks in the Chronological Order
Identifying tasks in chronological order may involve observing a process, talking to the audience, or reviewing any existing document. You can begin a rough chart or write out the steps in note form.
3 Organize the Data by Type and Corresponding Shape
The next step in planning and drawing a basic flowchart is to organize the process, data, decision, input, or output.
4 Draw Your Chart
You can draw your chart either by hand sketching or by using any program such as EdrawMind.
5 Confirm Your Flowchart
Go through the steps you have planned and make sure you have not missed any crucial details or information that you want to share with the audience.
6. Pros and Cons of Flowcharts
Advantages
-
Flowcharts provide better documentation.
-
They are a better way of communicating the logic of the system.
-
They help in debugging the process.
-
They act as guides for brainstorming and blueprinting during program design.
-
Programs and systems can be easily analyzed using a flowchart.
-
Flowcharts make the processes easy to plan, comprehend, and execute in marketing, business, education, and computer programming.
Disadvantages
-
For large and complex programs, drawing a flowchart becomes difficult.
-
Modifying a flowchart is a difficult task.
-
There is no standard to determine the amount of detail in a flowchart.
-
A complex flowchart might confuse understanding the process.
7. 3 Tips for Creating Better Flowcharts
Flowcharts are a great way to provide clarity around a process. However, they might end up causing some unwanted confusion. To create better flowcharts, consider the following tips:
Sticking with Consistent Design Elements
If you are using a circle to describe the start of a process, you should use a circle to end the process. Moreover, it is advisable to make each shape the same size and keep the balanced spacing between each flowchart step.
Keeping Everything on One Page
It is the best practice to keep all the flowchart elements on one page. If you feel you do not have enough space, you can try reducing the scale of your flowchart. Moreover, you can try changing the direction of flow.
Using Split Paths Instead of Decision Symbols
You can keep your flowchart moving from left to right by using a split path instead of a diamond symbol to represent a decision. It will make the flowchart easier to comprehend for the audience.
8. Key Takeaways
Flowcharts are a valuable graphical representation of a plan, data, or process. It enables you to brainstorm, express, comprehend, analyze, and evaluate a process in a better way. Flowcharts have been used for many purposes since the early 20th century. With time, they have become more effective and efficient in many ways. You can sketch a flowchart by hand or draw it using a program such as EdrawMind. EdrawMind is a valuable and powerful tool that can help you make flowcharts with several templates for studying marketing, business, engineering, and many other fields. It equips you with the tools required to make an impressive, comprehensive, and precise flowchart.
You May Also Like
Health Mind Map Complete Guide With 10+ Examples
EXAMPLES & TEMPLATES
Personal Mind Map Complete Guide With 10+ Examples
EXAMPLES & TEMPLATES
Business Mind Map Complete Guide With 30+ Examples
EXAMPLES & TEMPLATES
Mind Map Ideas for Students: Explained with 30+ Examples
EXAMPLES & TEMPLATES
Biology Concept Map Complete Guide With 30+ Examples
EXAMPLES & TEMPLATES