A Complete Guide to Understand KWL Charts in Education
Edraw Content Team
Planning to create KWL Charts for your Classroom?
EdrawMind helps move ideas forward, faster and better. Learn the benefits of KWL Charts from this EdrawMind guide, and start making KWL Charts for free!
Multiple recent researches have shown that visual learning helps the students or a company's employees to store information for a longer period. Keeping that in mind, schools and other academic institutes have started organizing such classes that focus on creating graphic organizers that help young students organize their receptive information before, during, and after learning about anything. This teaching methodology has proved to be highly successful for students who have problems concentrating or remembering complex topics.
This article will help you understand how KWL Charts help students organize their learning units. In order to explain them better, we have created a specialized KWL Chart template in EdrawMind that you can easily download for your academic purposes. However, before we head on to some interesting topics about KWL Charts, let us first learn about them in detail and see how it actually helps in the education sector.
1. What is a KWL Chart?
A KWL Chart is an effective graphic organizer tool used by parents and teachers to introduce their pupils to new topics. As we know, KWL Charts are created to keep everyone in the Classroom at the proper speed, and they can be applied to any business or personal vertical. KWL Chart is an acronym for:
- What do I know?
- What do I want to Know?
- What did I learn?
In order to understand how KWL Chart works, let us take an example where an English Grammar teacher plans to teach the students about Nouns and Pronouns. So, before starting the class, she will distribute the KWL Chart to the students, which will have three different sections. The first section will talk about the basic grammar knowledge that the students already know. The second section will be about what are the English Grammar topics that they intend to learn in that particular class session. The third and the last section in the chart will mention the topics that the students have learned.
- In the first section (What I Know?), the students might mention that they know about the alphabet or how sentences are created.
- In the second section (What I want to know?), the students will mention that they intend to learn about Nouns and Pronouns.
- In the last section (What I learned?), the students will explain the definitions of Nouns and Pronouns and might add some relevant examples of them.
As you saw here, the ultimate goal of creating a KWL Chart by the teachers or parents is to give rise to such peers or pupils who are self-directed and are capable of planning and executing their learning into real-life problems.
2. How does the KWL Chart Help in Education?
Most teachers and parents hand out the KWL charts at the beginning of the classroom session and prompt their peers to begin mentioning K and W columns. After completing the sessions, the students are then asked to fill out the L column, which the teacher in charge will access. In order to understand all these three columns better, let us see how K, W, and L help students learn and become self-directing individuals.
1 How Does K Help?
In the KWL Chart, the K Column talks about the student's prior knowledge about that particular field. It is mentioned in multiple research papers that we tend to easily connect the dots with new things if we can easily relate them to our previous understanding. By mentioning the details of a part that a student already knows, they can easily relate to the topics they wish to learn.
2 How Does W Help?
In the KWL Chart, the W column specifies the topics that the student wants to learn from that particular topic. By mentioning what they intend to learn, teachers can easily let students wonder beyond the simple logic of recognition. This way, they can mention those details that matter the most regarding that particular topic.
3 How Does L Help?
In the KWL Chart, the L Column mentions what topic they finally learned in that lecture. Such activities engage the students at a metacognition level that ultimately leads to better self-regulated learning methods. By letting the students engage in their metacognition level, teachers can bring out the best in those students who lack in certain areas of academic performance.
4 How Does KWL Help?
To put it simply, the immediate effect of creating a KWL Chart for the students is to make them active learners. Yes, several other similar graphic organizers, like Schema Maps, KQRN Chart, and more, help students easily grasp the concept. However, KWL Charts works on a metacognition level, making the students self-directed learners who can plan and analyze their learning without the support of any elder.
At the same time, KWL Charts help students prioritize information based on their usage. This way, they can easily discard irrelevant topics and reduce unnecessary memory burden.
Benefits of KWL Charts
Besides the fact that KWL charts make students self-directed learners, there are several other benefits of introducing them to a classroom.
- KWL Charts are among such graphic organizers that are extremely easy to use. A teacher can help the students understand how the KWL chart works for one time, and the students can create several different KWL Charts on their own.
- KWL Charts help the students demonstrate their level of knowledge.
- Since KWL Charts lets students connect the dots, it helps track and analyze the learning outcomes on a larger scale.
- By creating KWL Charts, students can get into a well-defined and engaging learning methodology.
- KWL Chart is a graphic organizer that puts students into a habit of creating well-organized notes.
- KWL Charts are independent of classroom studies and can easily be transformed as per students' needs.
3. KWL Chart Template & Example
(For Win)
(For Mac)
(For Linux)
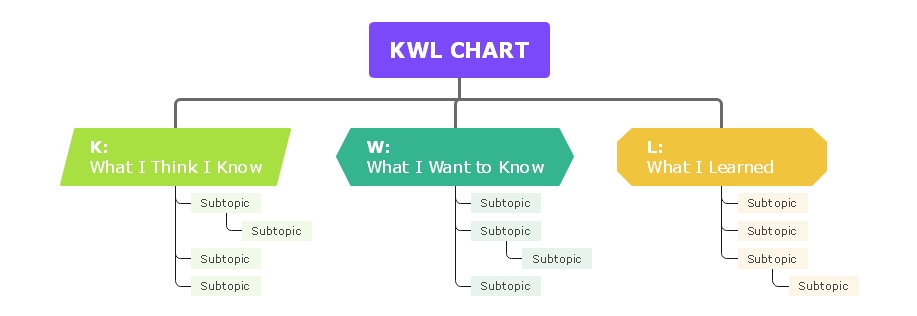
Here is a simple KWL Chart example to illustrate how KWL Chart works. As you see, we have created three sub-topics in EdrawMind:
- K: What I Think I Know
- W: What I Want to Know
- L: What I Learned
(For Win)
(For Mac)
(For Linux)
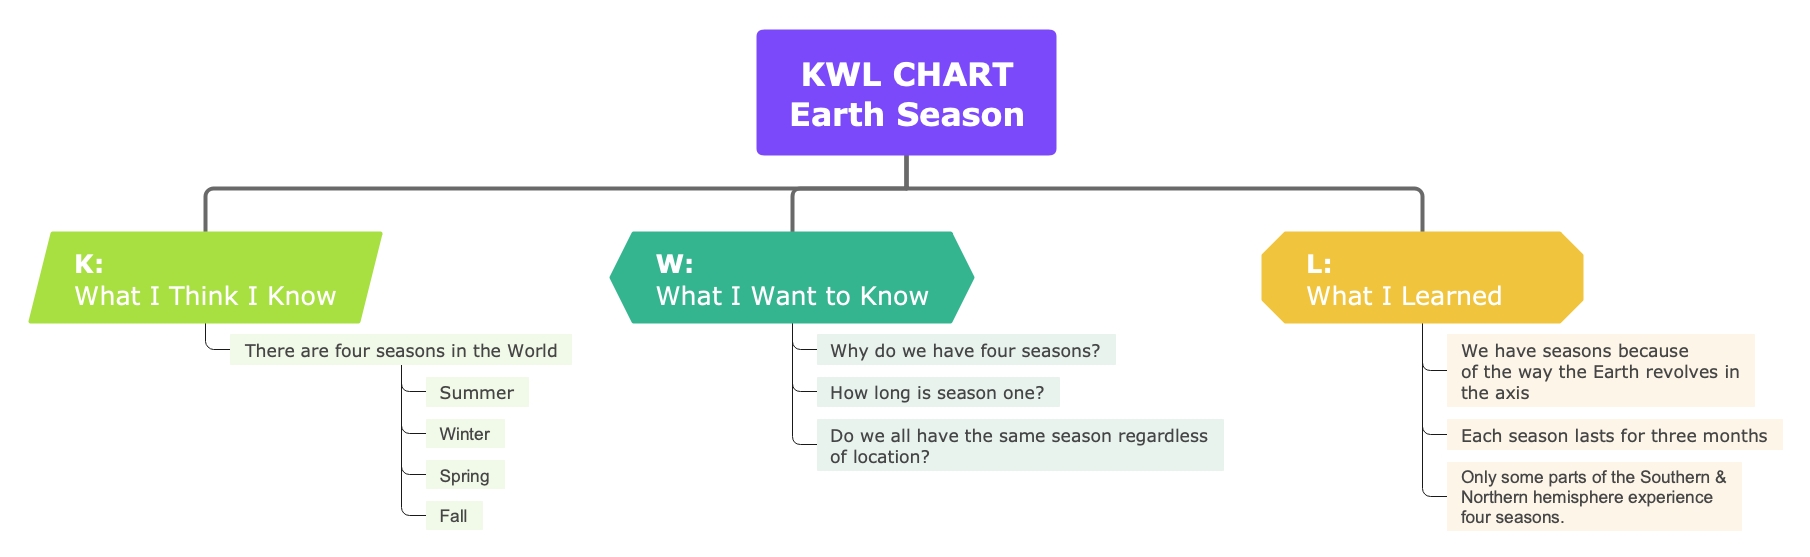
As per the following KWL Chart mind map diagram, we see that the students already know that there are four seasons in the world: Summer, Winter, Spring, and Fall. So, we have mentioned that under the sub-topic titled K. Now, the student can go-ahead to the next subtopic titled W where they mention what they want to know. Here, they can ask simple questions, like, "Why do we have only four seasons?" "How long is Summer?" and "What comes after Summer?" After they do their research or a teacher teaches them about the weather, they can head to the last subtopic, titled L, where they will mention what they learned from the lecture. Their learning can be explained in sentences, like "Each season lasts for three months," "We have seasons because of how the Earth revolves on the axis," and so on.
4. How to Use KWL Chart?
KWL Chart follows a very straightforward graphic organizing technique. As mentioned in the KWL Chart example, there are only three steps that a student has to follow.
- Start with the "Know" Column:
Under this column, the students will fill out the details about the topic they already know. If it is a follow-up lecture, the students can fill out what they learned in the previous section or the class.
When you create the KWL Chart, ensure that this is the first step that your students will fill out. You can either go ahead and draw the chart on the board or can create KWL Charts for free in EdrawMind. This column will technically help the teachers if there is any wrong information circulated among the students or if there are any misconceptions pertaining to the topic. - Fill out the "Want to Know" Column
Once the entire Classroom has identified what they already know, a teacher can ask the students to answer what they want to know about this particular topic? A teacher can split the Classroom into multiple groups or distribute the sheet individually. Remember that if your class does not have much knowledge about the topic, you should help them by providing them with some prompt questions that will help them think on a metacognition level.
One of the easiest ways to fill out this column is by asking the students to note down: Who, What, When, Where, Why, and How. This is a journalistic approach to writing about any topic, and it will prepare the students to ask important questions. - Add in "Learned" Column
Now, a teacher can start teaching about that particular topic. Meanwhile, the students can refer to their KWL Chart to see whether or not their questions are being answered or not.
In this column, the students will record all the points they learned in the lecture. Ask the students to go ahead with pointers and not full-length paragraphs, as it becomes easier for them to have a glance and memorize the important sections of those answers.
Now when the KWL Chart of the students is completed, you can quickly check them to see what the students have learned. If there are no errors, you can ask them to note down all the information they have noted down in the KWL Chart in their notebook in an elaborated format. This way, they will be able to learn everything about that topic in detail.
5. Key Takeaways
KWL Charts is one of the highly used learning methods being used by several institutes. It is a fun exercise and is also considered a powerful tool for students to engage in study material to improve their overall academics-related performance. At the same time, one creates a KWL Chart even if they undergo office meetings where the team will discuss prospective projects.
As you saw in the KWL Chart example section, EdrawMind is a powerful offline and online tool that caters to your mind-mapping needs. The 2D mind mapping software comes with some amazing templates and themes. You can export your file into multiple formats and even share it on different social media platforms from the in-built sharing option. So, what are you waiting for? Click on the download button and start creating KWL Charts for your classroom education.
You May Also Like
Health Mind Map Complete Guide With 10+ Examples
EXAMPLES & TEMPLATES
Personal Mind Map Complete Guide With 10+ Examples
EXAMPLES & TEMPLATES
Business Mind Map Complete Guide With 30+ Examples
EXAMPLES & TEMPLATES
Mind Map Ideas for Students: Explained with 30+ Examples
EXAMPLES & TEMPLATES
Biology Concept Map Complete Guide With 30+ Examples
EXAMPLES & TEMPLATES