
What is a data flow diagram?
You use a data flow diagram or DFD to visualize elements that relate several parts of an information system together. It is generally used in the IT and engineering industries to present information flows, data input sources, and the way data is stored. You can explain complex processes to vital stakeholders or build new frameworks with your team through this diagram.
Clear visualization of every element in the diagram allows teams to determine possible inefficiencies and create an excellent system. Data flow diagrams come in two categories - physical and logical. A logical data flow presents the flow of data using a system to perform specific business functionalities. Meanwhile, the physical data flow is the implementation of logical data flow.
History of data flow diagram
The diagram generally started from a graph theory, used initially in operation study to represent organization workflow. The chart was popularized during the late 1970s which was commonly used in structured design techniques and analysis methodology. Few personalities who popularized the structure include Trish Sarson and Chris Gane.
Using the data flow diagram template immediately became a popular method to illustrate significant steps and data involved in the software-system process.
Data flow diagram symbols
The symbols used in the data flow diagram include standardized notations such as circles, rectangles, short-text labels, and arrows. They are strategically in the chart to describe a process or system's data flow direction, data outputs and inputs, storage points, and its different sub-processes.
There are four symbols that the diagram uses, which includes the following:
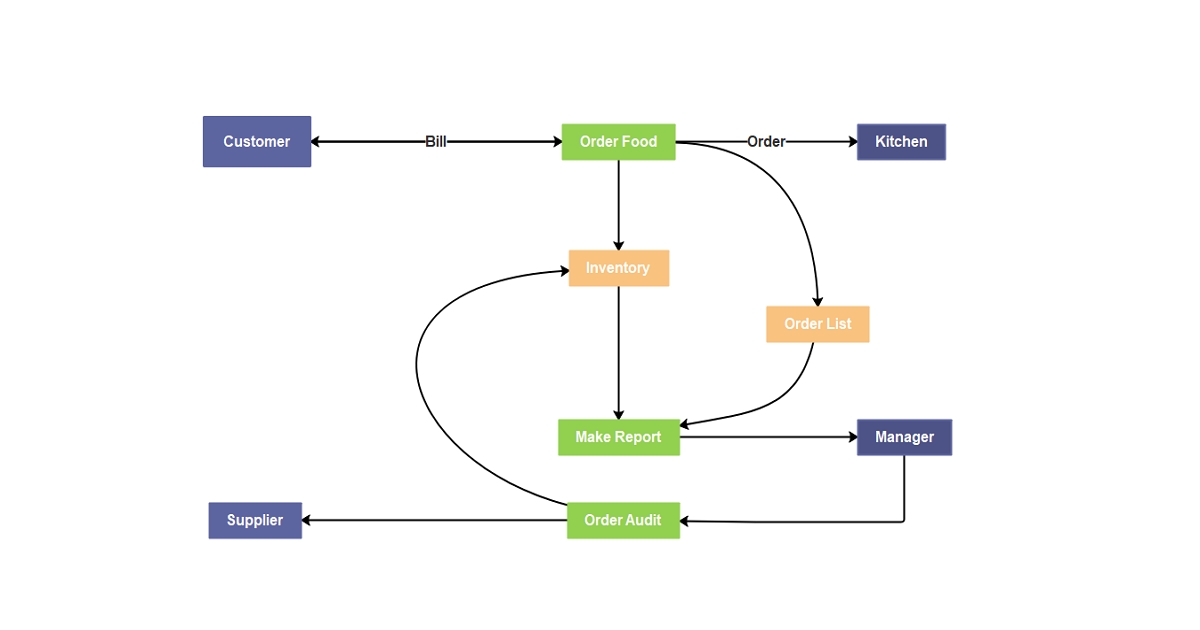
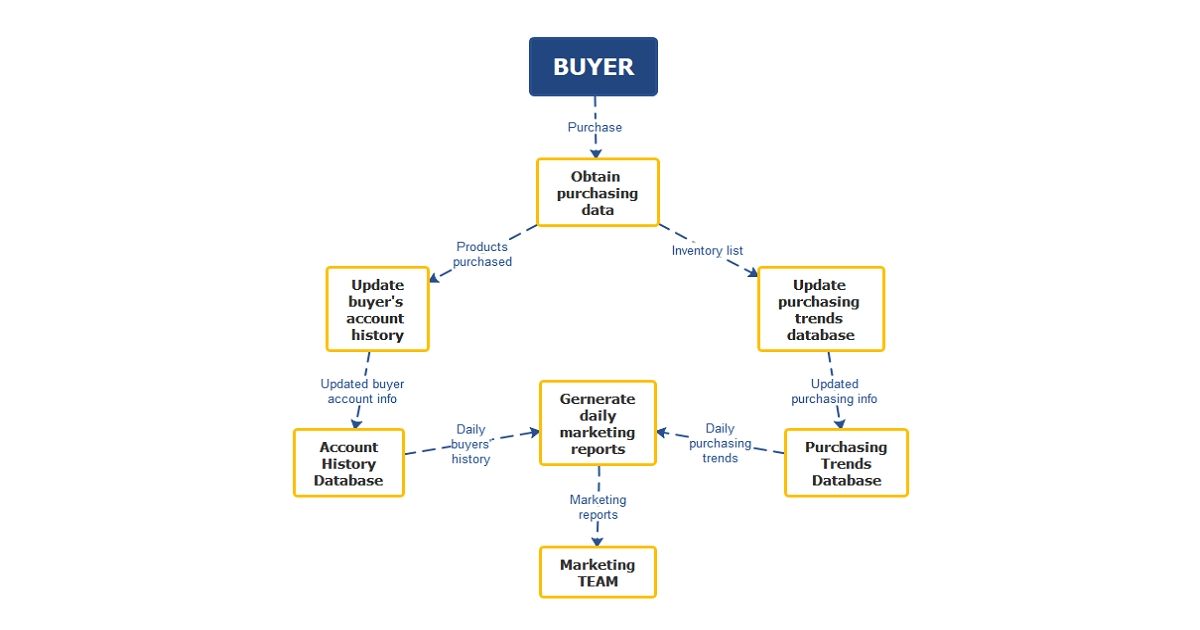
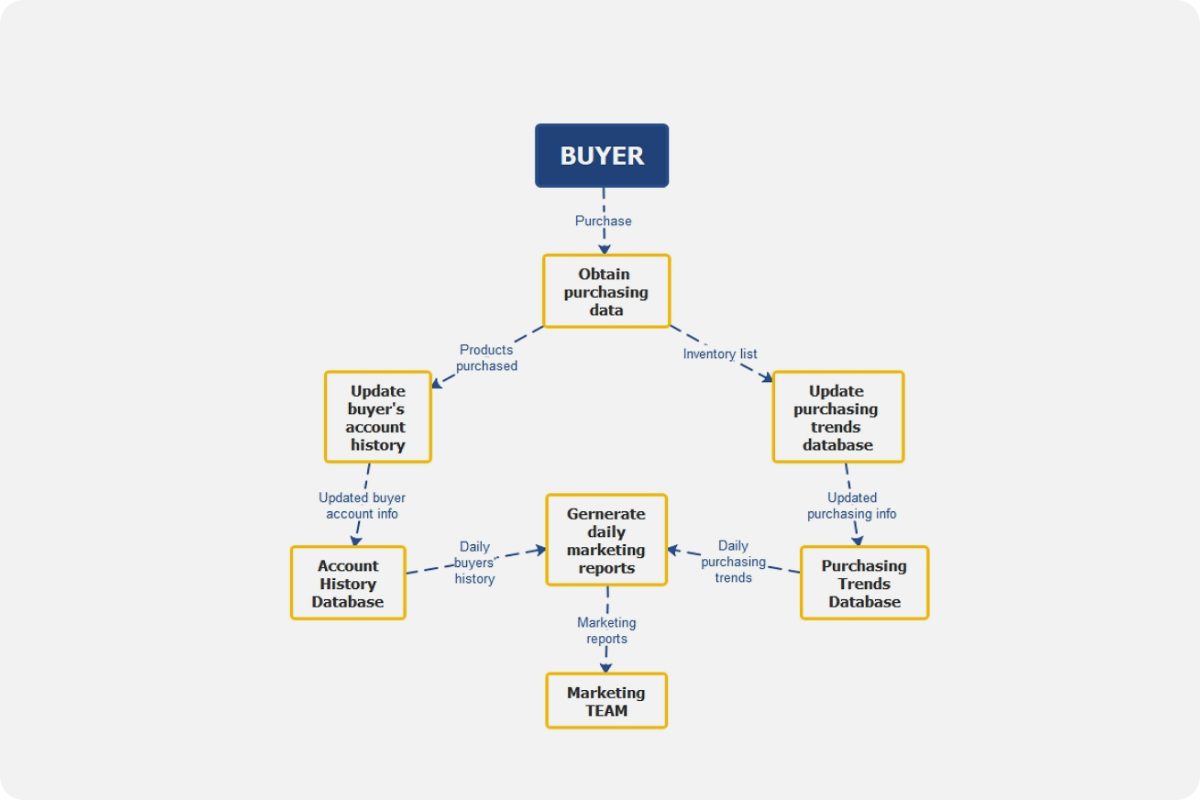
- External Entity These symbols are also called sources, terminators, actors, or sinks which is an outside process or system responsible for sending and receiving data to and from a structured system. They can either be destinations or sources of information; that is why they are generally placed on the edges of the diagram.
- Process You usually see this symbol starting from the top left of the diagram and finishing at the bottom right. Process in the data flow diagram is a method that manipulates the flow and data, takes incoming information, changes it, and produces an output. A process does this by using logic to sort data and perform computations or changing the direction flow.
- Data Store Data stores are responsible for keeping information for future use. It is similar to document files that are waiting to be processed. They can also be referred to as files. Every data store receives a simple label like Orders.
- Data Flow This is a path through which the system's information goes through from one part to another. It can be a single data component or a set of it. When you look at the DFD, the data flow is symbolized with an arrow representing a direction flow.
Data Flow Diagram Examples
A data flow diagram, just like any other chart, can be done either traditionally or using an online diagramming tool. With various online tools today, you can choose from multiple templates and even turn to mind maps to clearly illustrate your frameworks.
DFD also is classified by levels. To visualize how these levels look, refer to the following structures below:
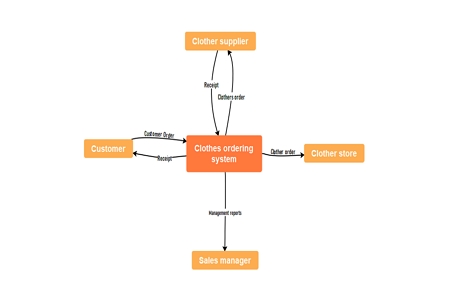
Level 0 DFD
These diagrams are the most basic ones and are also called context diagrams. They offer a contextual framework of securities trading platforms. Level 0 DFD offers a broad view that is easy to digest but provides only a few details. It only has one process node and the diagram's connections to the external entities.