Fishbone Diagram Template

Visualize the possible sources of an issue so that you can work together to fix it.
USE THIS TEMPLATE
product 5 ways template

About the Fishbone Diagram Template

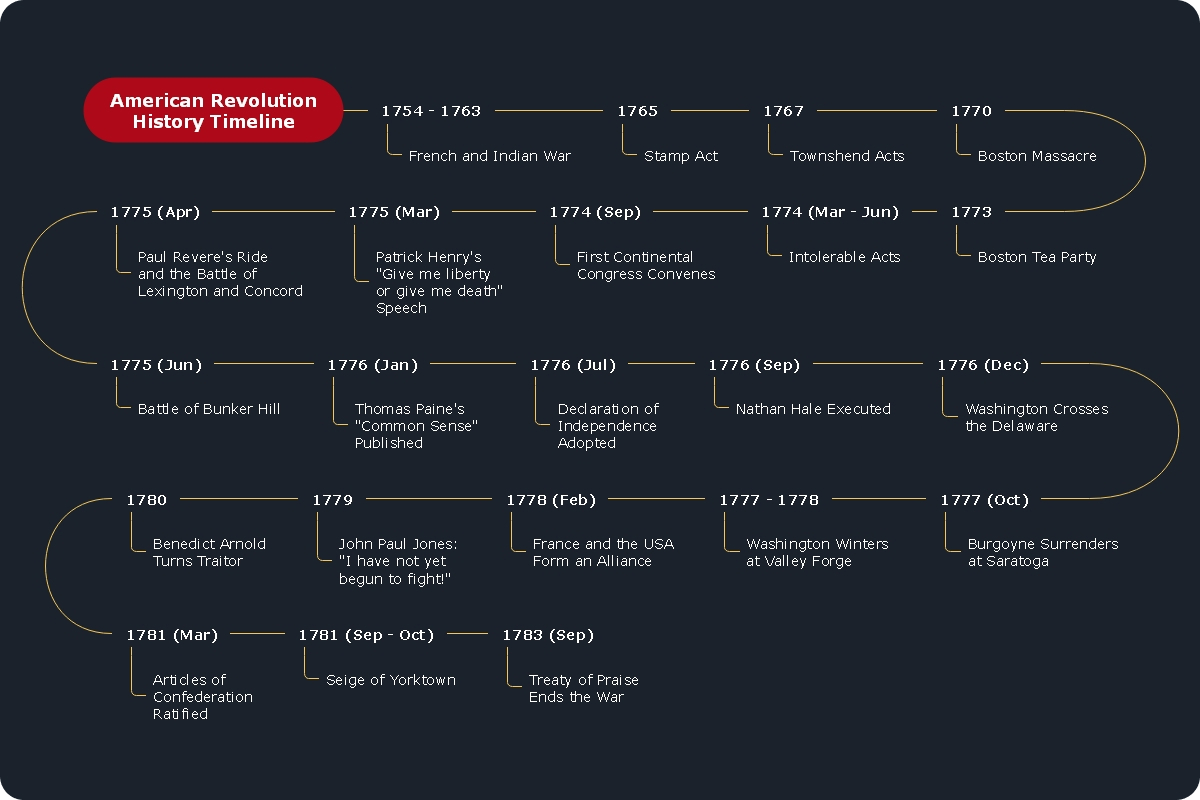
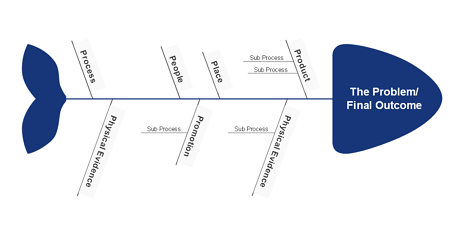
The Fishbone Diagram can help your team narrow down the potential causes of a problem, which should lead to a better answer. A fishbone diagram is a valuable tool for isolating and categorizing the various causes of an issue in a business. The Ishikawa diagram, or "fishbone diagram," is a pictorial cause-and-effect diagram that encourages managers to identify the root of problems. It uses a sensible and understandable structure that aids in pinpointing the causes of process variance. Put your ideas together to find out what's at the root of the issue once you've come up with a few solutions.
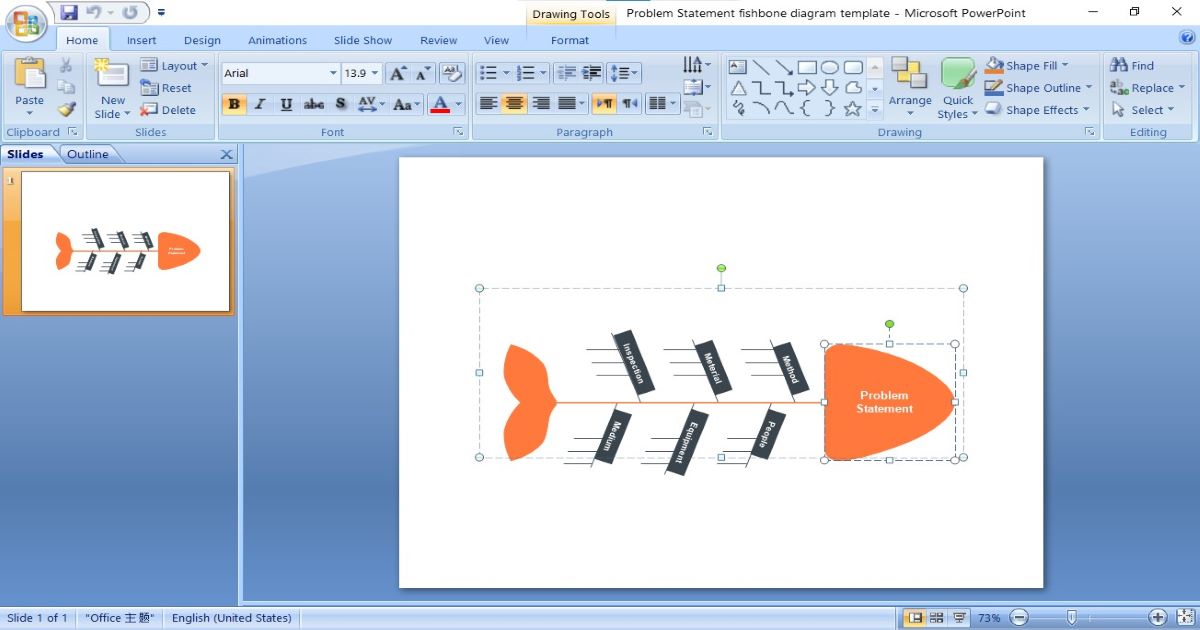
A Fishbone Diagram template is helpful if one must rely on anecdotes and intuition rather than complex data. After all potential causes of an issue have been examined, the facilitator helps the group create a hierarchy based on the importance of the factors. This name was given to the diagram because of its structure, which is reminiscent of a fish skeleton. When drawn from right to left, fishbone diagrams have the larger "bones" of the fish branch off into smaller "bones" for less severe issues.
This article provides free Fishbone Diagram templates that can be used for a variety of situations.

Free Fishbone Diagram Templates

1. Marketing Fishbone Diagram Template
When developing your marketing strategy fishbone diagram, you can get a head start using the Marketing Fishbone Diagram Template. You may save the file to your computer and use it to create your very own marketing fishbone diagram.
2. Problem Statement Fishbone Diagram Template
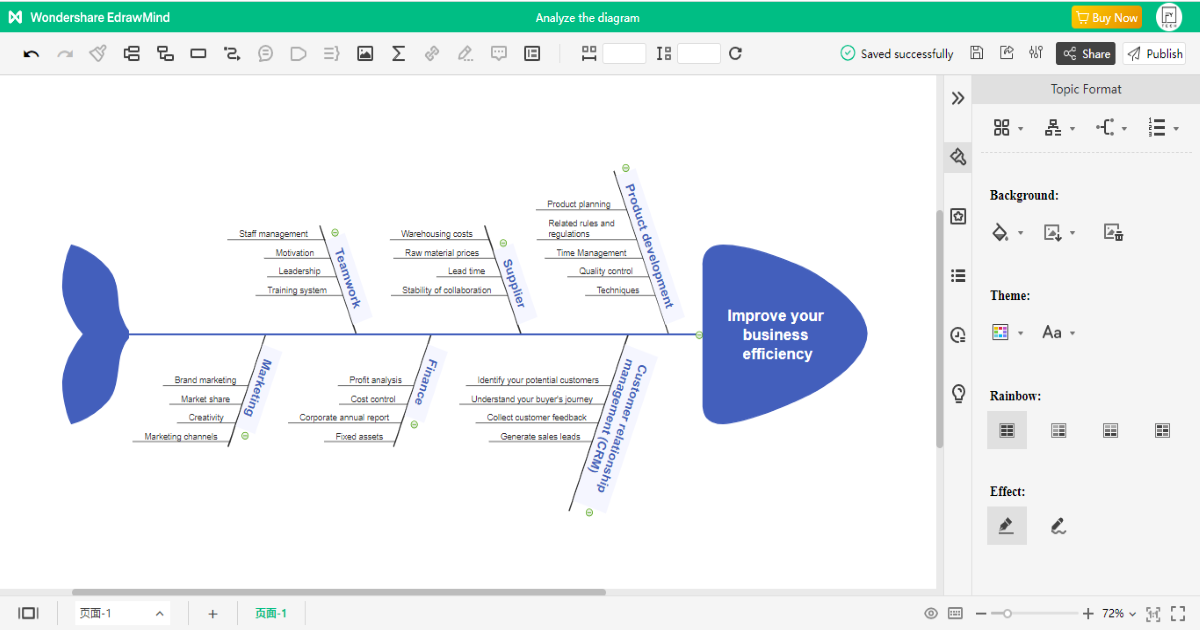
Using a fishbone diagram as a starting point for the root cause analysis is a simple method to get started. Visual components can be used to represent the problem, the categories of reasons that contributed to it, and the causes that contributed to those causes. The arrows in the diagram demonstrate the causal connection between the various parts and how they relate to the problematic occurrence. Fishbone diagrams are adaptable problem-solving tools that can be applied in any field or setting.
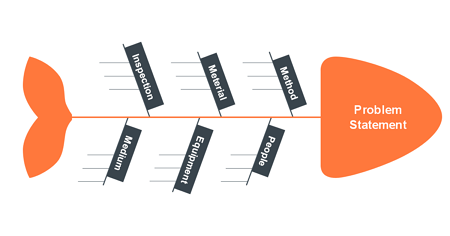
3. Production Process Fishbone Diagram Template
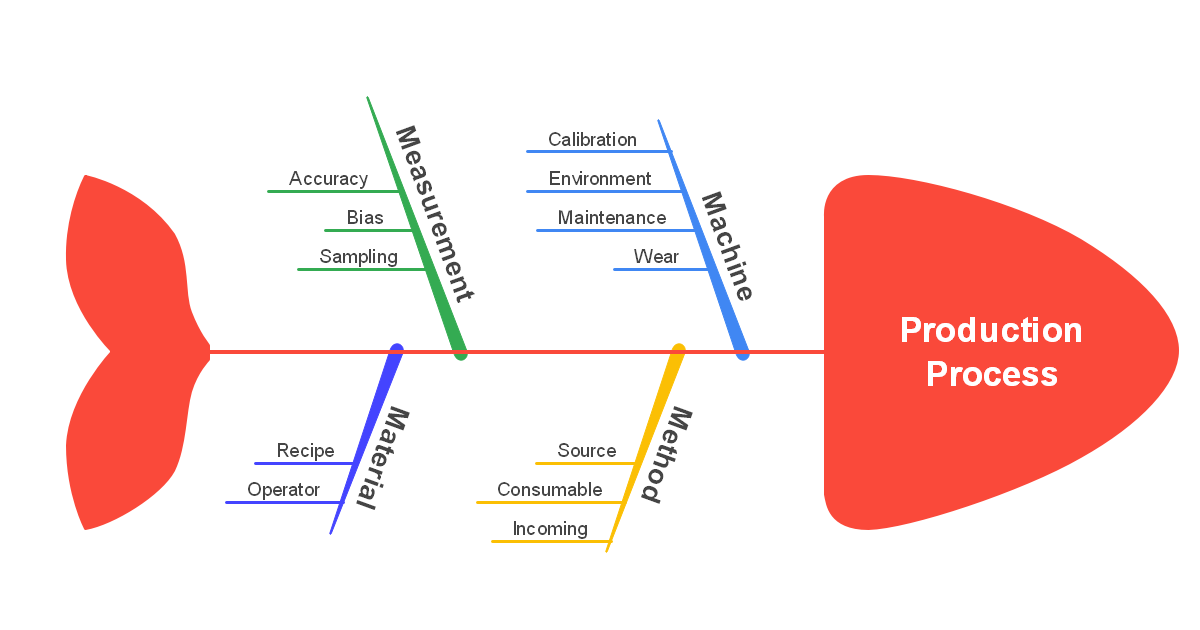
This template represents an assembly line production process as consisting of many kinds of functions and steps. On the diagram, every component has been placed where it should be according to the instructions.

What is Fishbone Diagram?

The fishbone diagram, or cause-and-effect diagram, is a graphical representation of the various sources of a problem or flaw.

Pros of Fishbone Diagram

Benefits of using fishbone diagrams in process improvement and problem solutions stem from its visual thoroughness. Some of the benefits of the tool are highlighted below.
  • A problem statement, its primary reasons, and their supporting secondary causes can be represented graphically using a fishbone diagram.
  • The graphic is helpful for brainstorming since it consolidates all of the potential avenues of thought into one central location.
  • Members of the team and other interested parties can gain insight into the current problem status using the graphical tool.

Cons of Fishbone Diagram

Some of the most evident benefits of using a fishbone diagram might also become obstacles if you don't use it properly. Following is a summary of some of the drawbacks of the Ishikawa diagram.
  • When depicting intricate problems with several causes and sub-causes, the resulting diagram may become unwieldy and difficult to read.
  • A brainstorming session may yield a laundry list of unimportant facts and reasons.
  • It might be challenging to recognize the interconnectedness of numerous causes and circumstances.

How to Make a Fishbone Diagram

Creating a fishbone diagram can help identify bottlenecks in a process, issue regions, and the underlying causes of a problem. This article will discuss how to draw a fishbone diagram and its uses.
Step 1: Determine a Problem Statement
First, your team and any relevant stakeholders need to settle on a problem statement that accurately captures the nature of the issue at hand. The diagram's heading also serves as the statement's visual representation (fishbone skeleton). The direction of the head is indicated by an arrow drawn horizontally across the page (the fish backbone).How to Make a Fishbone Diagram
Step 2: Think about Major Causes or Options
They are categorized into categories to facilitate the possible causes of the problem, including manpower, method, machine, material, medium, and measurement (using the 6Ms approach to root cause analysis). Arrows pointing to the fish's backbone are represented as the bones of the categories.How to Make a Fishbone Diagram
Step 3: Brainstorm all the Possible Causes or Options
The analysis group should employ root cause analysis techniques like the 5 Whys to identify subcategories of causes that feed into the larger categories. In the diagram, these are depicted as extensions of the fish skeleton. The layered bones that form once root causes have been isolated reveal the interconnectedness of those factors.
Step 4: Analyze the Diagram
The team can identify and evaluate all potential causes by asking why questions. If the source of the claimed problem has not been found after more brainstorming, consideration is given to regions of the diagram with fewer ideas.How to Make a Fishbone Diagram

How to Make a Fishbone Diagram in PowerPoint, Excel or Word

You can generate a fishbone diagram with the help of EdrawMind and then effortlessly export it to PowerPoint, Excel or Word. After exporting your Fishbone Diagram, you can change it in PowerPoint, Excel or Word at any time; you will not need to return to EdrawMind to export it again.
Make a Fishbone Diagram in PowerPoint, Excel or Word

Key Takeaways

Making visual representations of your concepts, ideas, and other information is accessible with EdrawMind. As the name implies, this software supports a variety of operating systems. There are no compatibility difficulties with the most widely used systems, including Mac OS X, iOS, Android, Linux, and the Web. The collection of professionally created templates and pictures in EdrawMind is one of its best features. You can also use the community library for EdrawMind, constantly expanding and has thousands of professionally and user-designed editable templates. EdrawMind is a Fishbone Diagram creator and mind mapping software that is quite strong. You can make your fishbone diagram on Edrawmind by downloading EdrawMind. Watch this tutorial to make your fishbone diagram on EdrawMind tutorial video.