About the BCG Matrix Template
What is a BCG matrix?
For companies with huge portfolios, it is essential to regularly evaluate the product lines to determine which among the products is profitable, which needs some improvements, and which are making losses. This assessment process allows the companies to allocate resources accordingly for their business processes to function efficiently.
While tools and practices may be available today, the BCG matrix is one of the most common mediums for finding cash cows, stars, question marks, and dogs. This matrix is an analytical medium used to rank strategic business units and products based on the relative growth rate and market share. Using this matrix, you can have a quick overview of how your products are doing and guide you through creating a basis for future analysis.
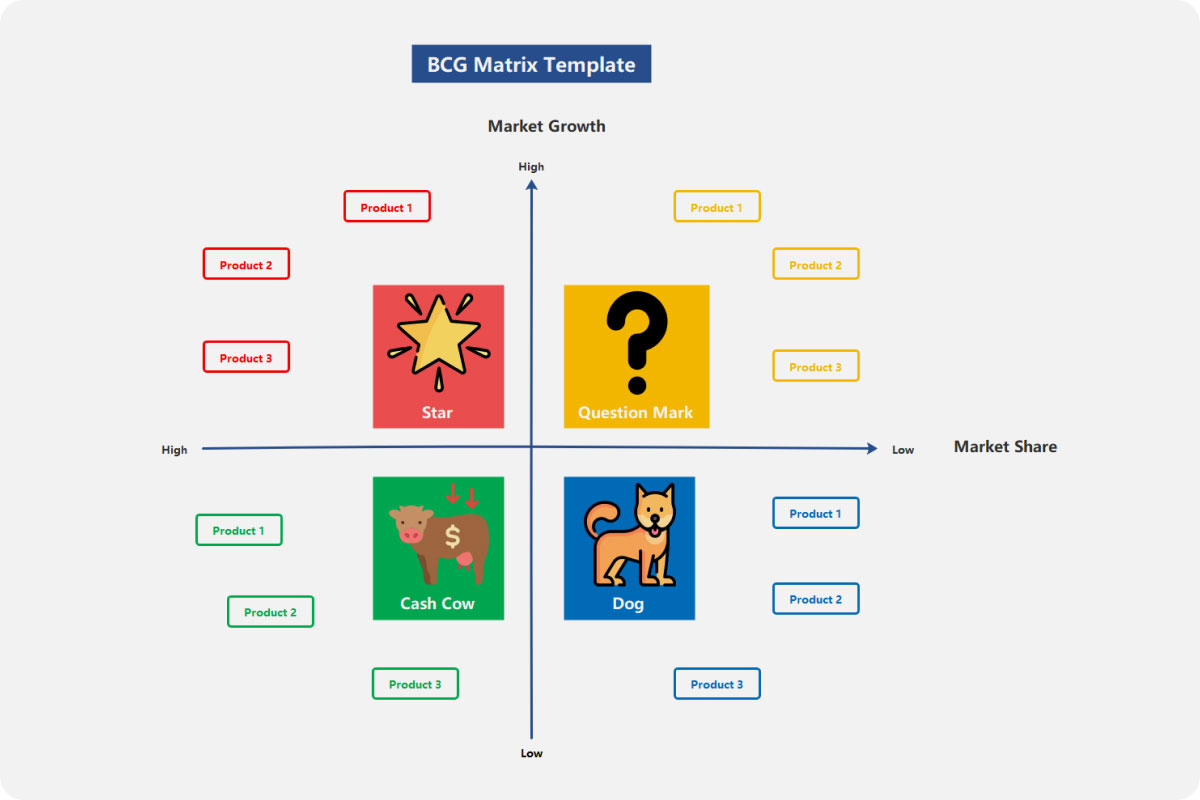
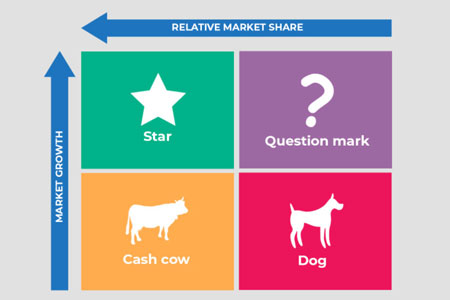
Four elements comprise the BCG Matrix. These are the following:
- Cash Cows. These can be business units or products in a slow-growing industry with a high market share. They generally produce cash over the amount required to keep the business afloat.
- Dogs. Dogs, meanwhile, are those business units in a low-growth industry with a low market share. These units generally ‘break-even,’ producing just enough money to keep the business’s market share. In most cases, enterprises sell off this aspect.
- Question marks. They are also termed as the ‘problem children.’ They typically operate with a low market share in a high-growth market. They have the potential to become stars and gain market share, then eventually turn into cash cows. Businesses must analyze question marks thoroughly to identify whether they are worth investing in for market share growth.
- Stars. They are a business unit in a fast-growing industry with a high market share.
Why should you use a BCG matrix?
The BCG matrix template is useful in various company areas, including strategic management, business portfolio analysis, and marketing. As you categorize every product in the portfolio, you can better decide what products you need to continue investing your time in and which products are not worth the investment anymore.
How do you make a BCG matrix?
Every company differs in how they process their BCG matrices. In most cases, here are a few steps that are commonly followed by businesses to create this matrix:
1. Choose the business unit or product. The first thing you need to identify is the specific element you want to analyze. It could be a product, separate brands, business units, or a firm. Choosing the unit will have an impact on the whole analysis.
2. Define the market. If one fails to define the market accurately, it can lead to poor product classifications. To better understand the portfolio position, an essential prerequisite is defining the market accordingly.
3. Relative market share calculation. Market share means the total market serviced by a company, measured either in unit volume or revenue terms. The relative market share is used in this particular matrix to compare product sales with the top competition’s sales of a similar product.
4. Identify the market growth rate. You can immediately find the industry growth rate from accessible sources online. It can also be computed by identifying the average revenue growth of leading companies.
5. Draw the brands on the matrix. After all the calculations and assessments, you can now map out the brands on your matrix. There are several online tools that you can use as a BCG matrix template, or you can make your matrix from scratch. The good thing about online tools is you can use colors, stickers, and images to highlight essential elements on the diagram.
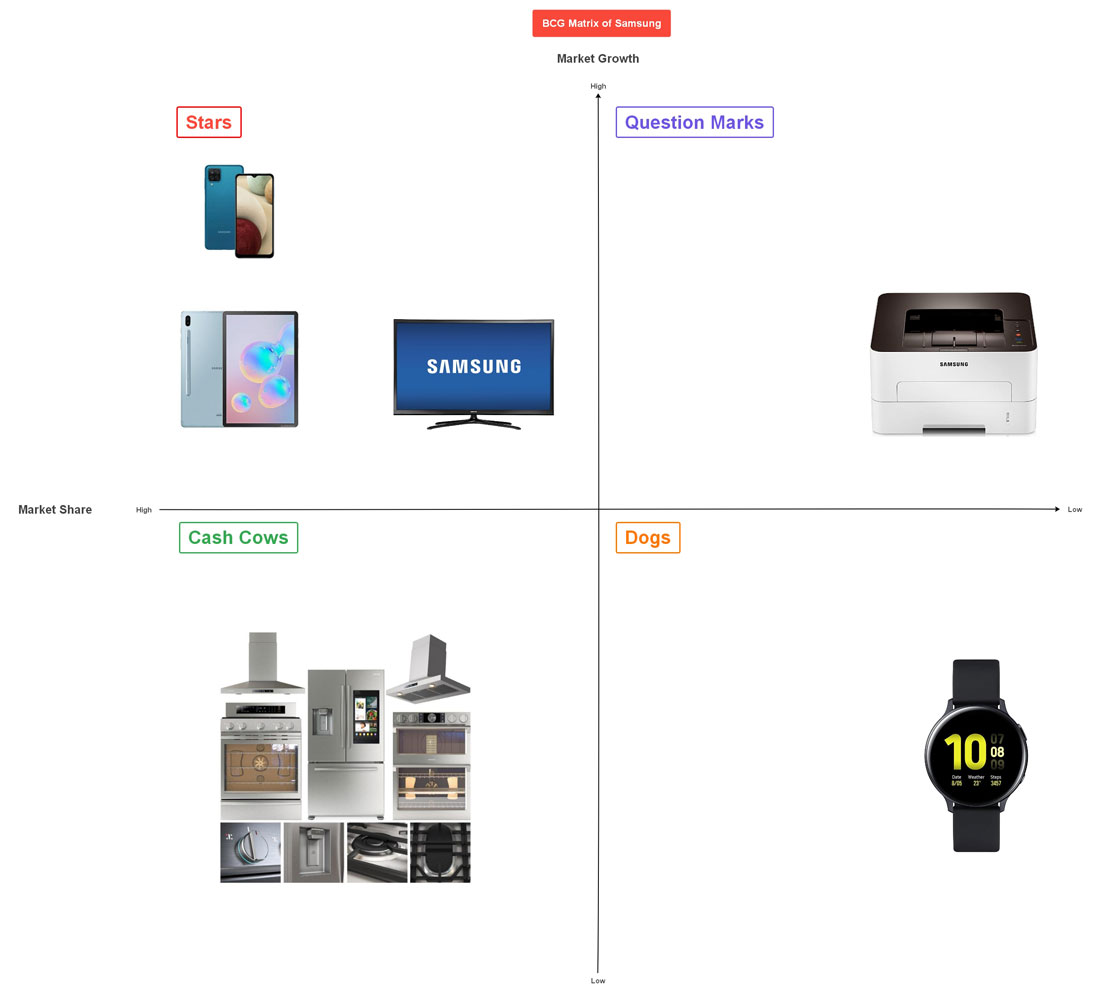
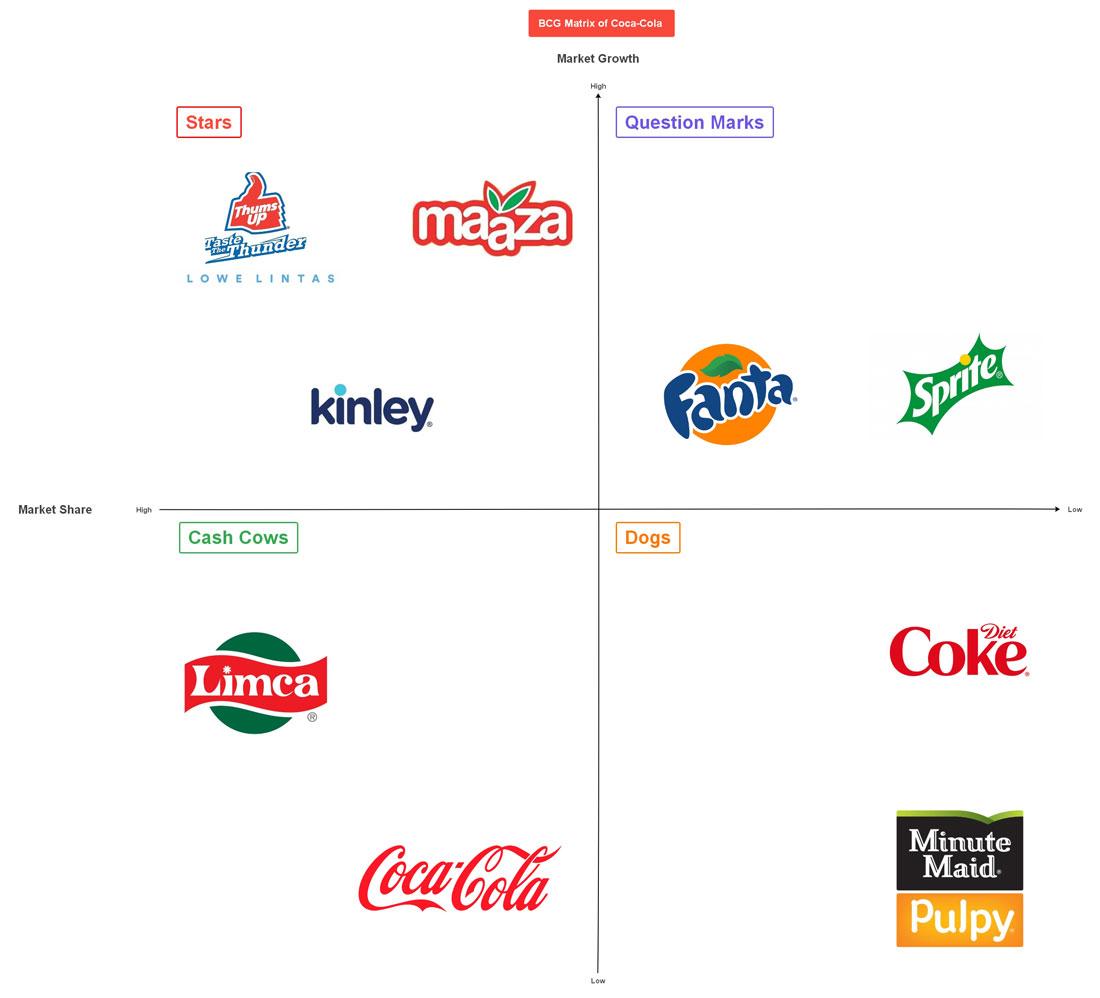
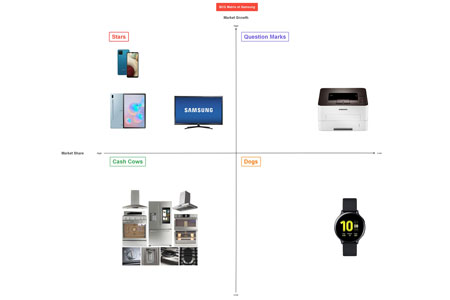
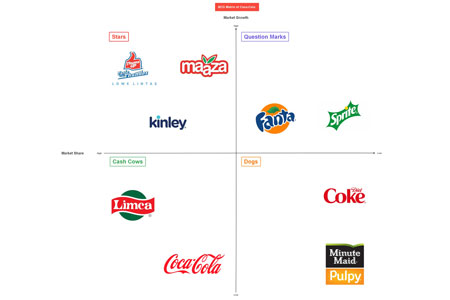
BCG Matrix Examples
Some businesses call this a Boston matrix template, primarily because BCG also means Boston Consulting Group matrix. Most companies use this matrix because it is straightforward to use. Here are some examples of the matrix used by some famous brands: