What is a quantitative research concept map?
Quantitative research is an excellent research structure typically utilized in social sciences. The framework comprises the set of strategies, assumptions, and techniques used to study social, economic, and psychological processes by exploring the numeric patterns. It gathers several numeric data.
Research is already a complex concept, and if you include numbers in it, it can be confusing if you do not categorize them. A quantitative research concept map can consist of graphs and charts to test or confirm theories.
Advantages and disadvantages of quantitative research
Here is a quick comparison of the benefits and limitations of this research medium:
Advantages
- Anonymous research. The anonymity of respondents is an excellent benefit in research. Participants will be more comfortable and are likely to share an honest response as they become confident that their feedback will not be revealed.
- Straightforward analysis. As you gather quantitative data, the results will help you determine what statistical methods are appropriate to utilize. It makes interpreting data and presenting findings easier and lessens the probability of subjectivity and error.
Disadvantages
- False focus on statistical data. When focusing entirely on numbers, you may risk missing big-picture and surprising information that can benefit the overall research process and result.
- It can be misleading. People might think that since quantitative research is based on statistical data, they are more credible than qualitative research. Biases and opinions of researchers are just probably to impact quantitative methods of information gathering.
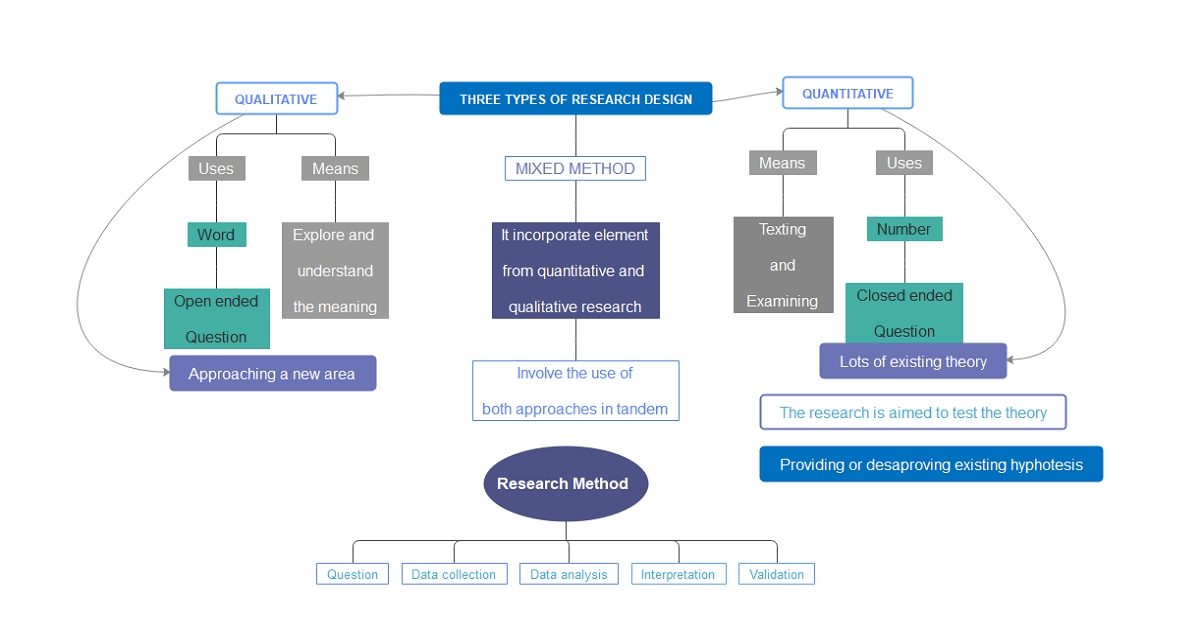
Quantitative vs. qualitative research
Besides quantitative research, there is also what they call a qualitative approach to research. See the chart below for key differences.
|
Quantitative Research |
Qualitative Research |
|
Since quantitative research involves statistical data, it generally assumes a measurable and fixed reality. |
The concept of qualitative research revolves around the recognition of human behavior from an informant's perspective. |
|
All data for this research are gathered by measuring things. |
Researchers gather data through interviews and participant observations. |
|
Once all the data are collected, they are analyzed by using statistical references and numerical comparisons. And the findings are organized using statistical analysis. |
The data are organized based on themes from informants' descriptions. They are then reported in the informants' language. |
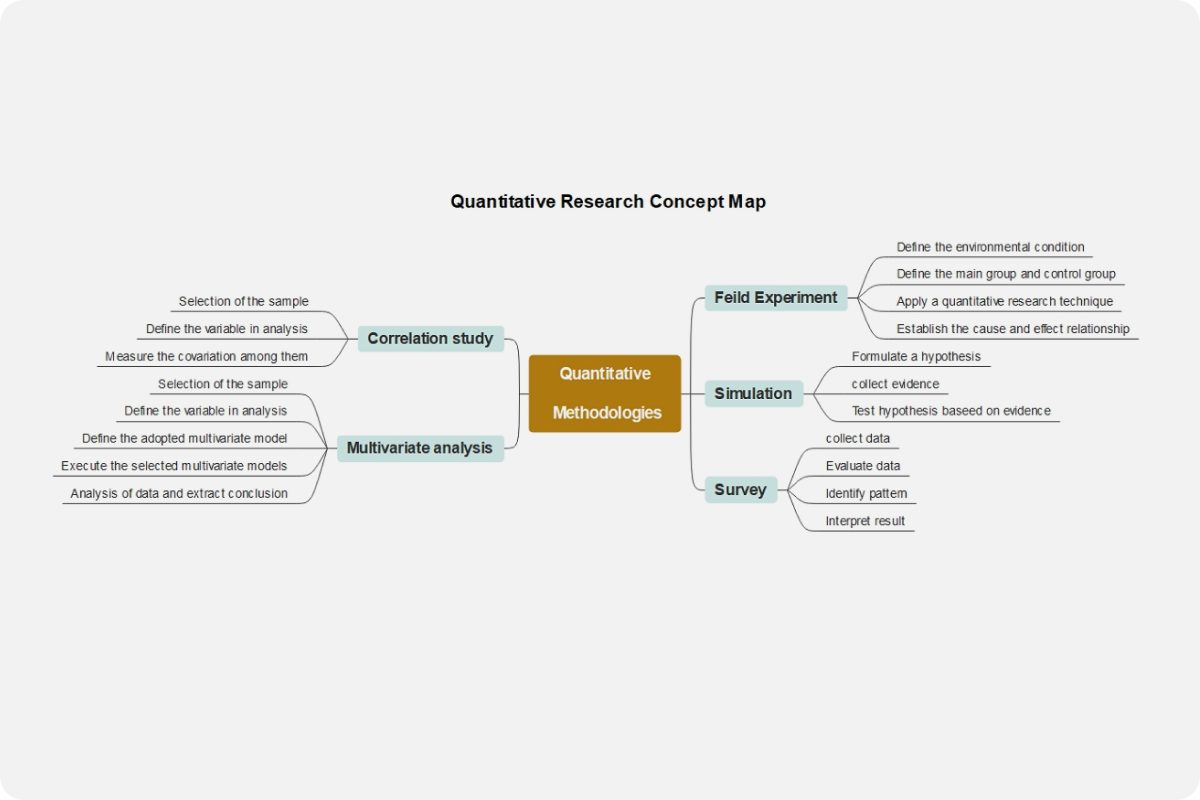
Quantitative Research Concept Map Examples
Since every research is unique, there are several ways to present and report your quantitative analysis. Below are some of them:
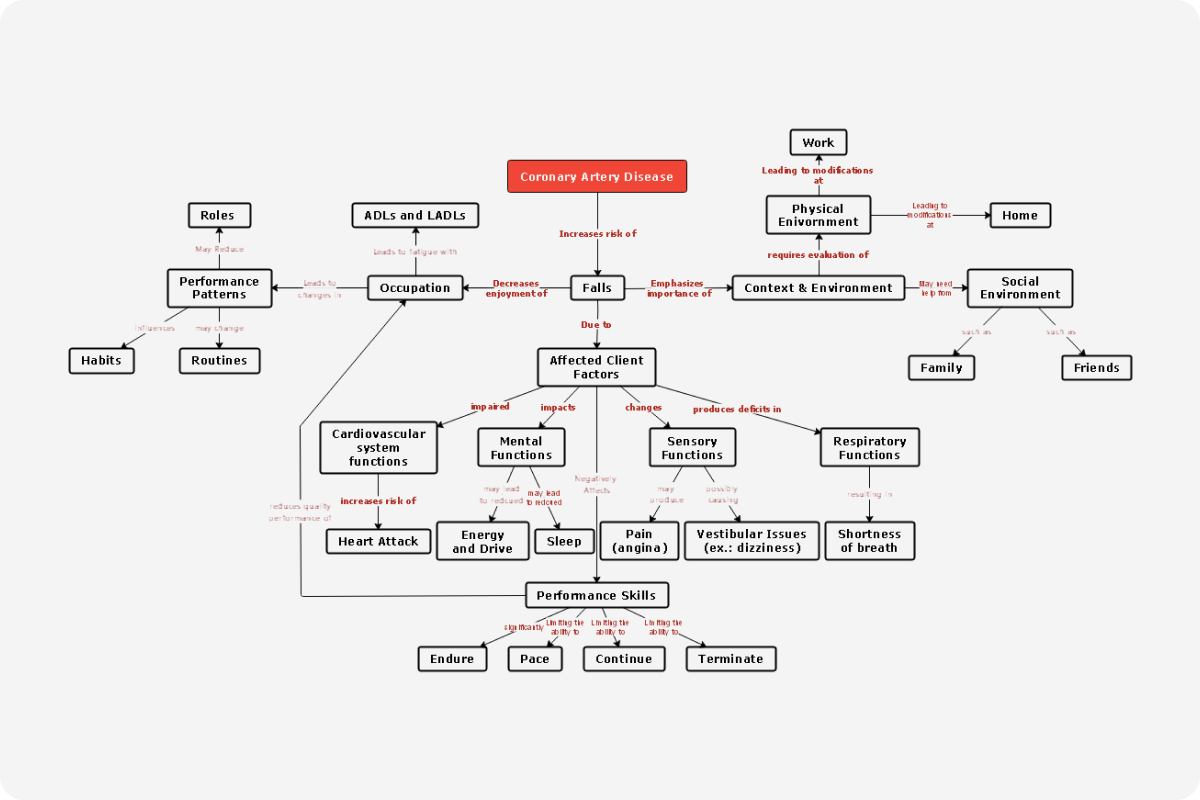
Example 1
This qualitative research concept map focuses on gathering information from a focused group that can relate to the given subject. Since qualitative research allows anonymity, you can see that no names of research respondents are included in the diagram. Instead, it focuses on the percentages after the focus group survey. Several online diagramming tools will make it happen if you wish to add more graphs and numbers to your concept map.
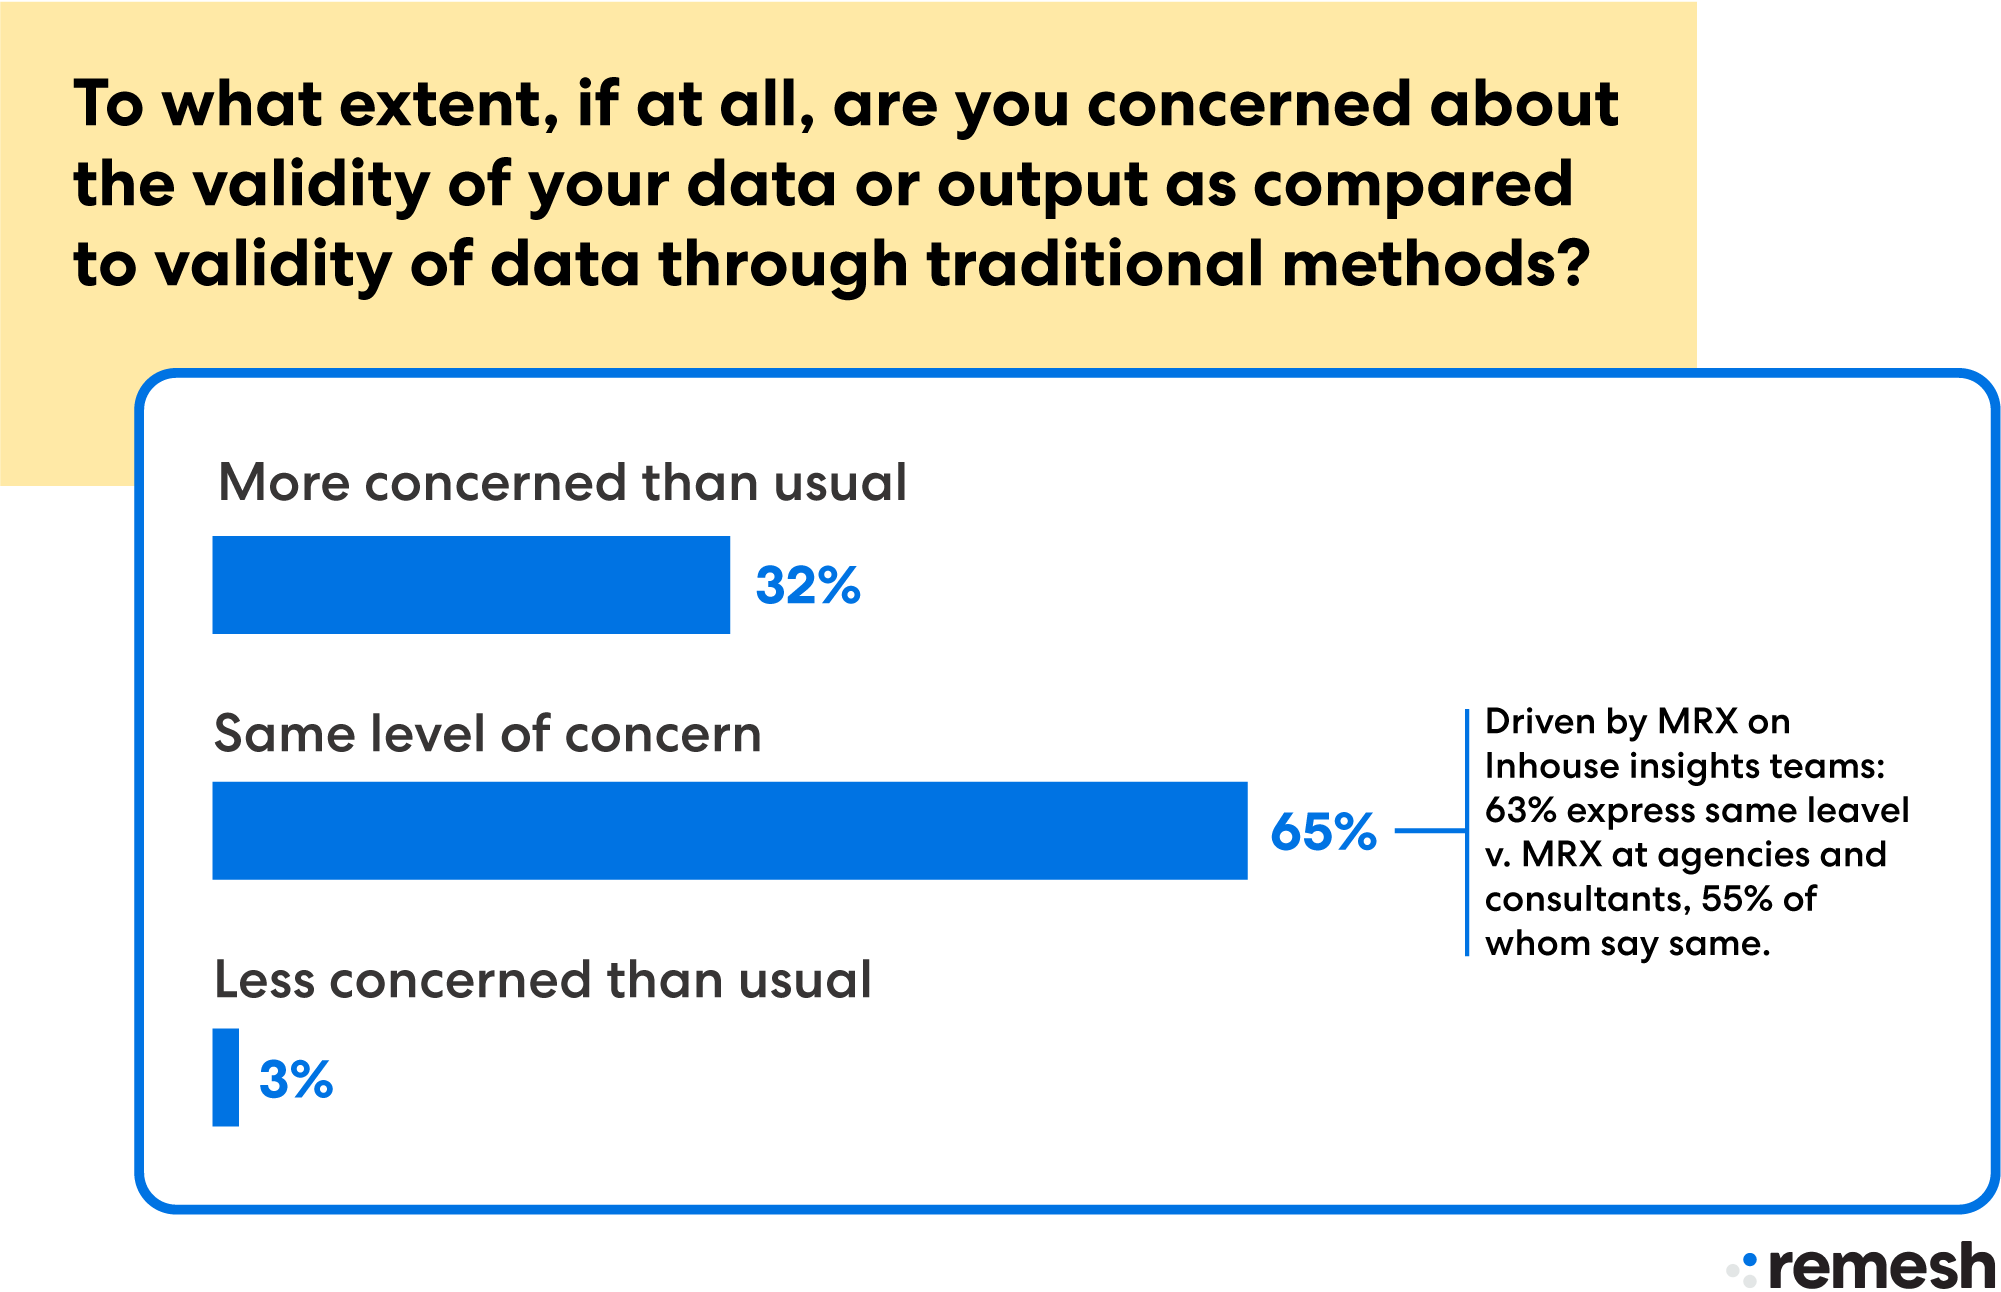
Source: blog.remesh.ai
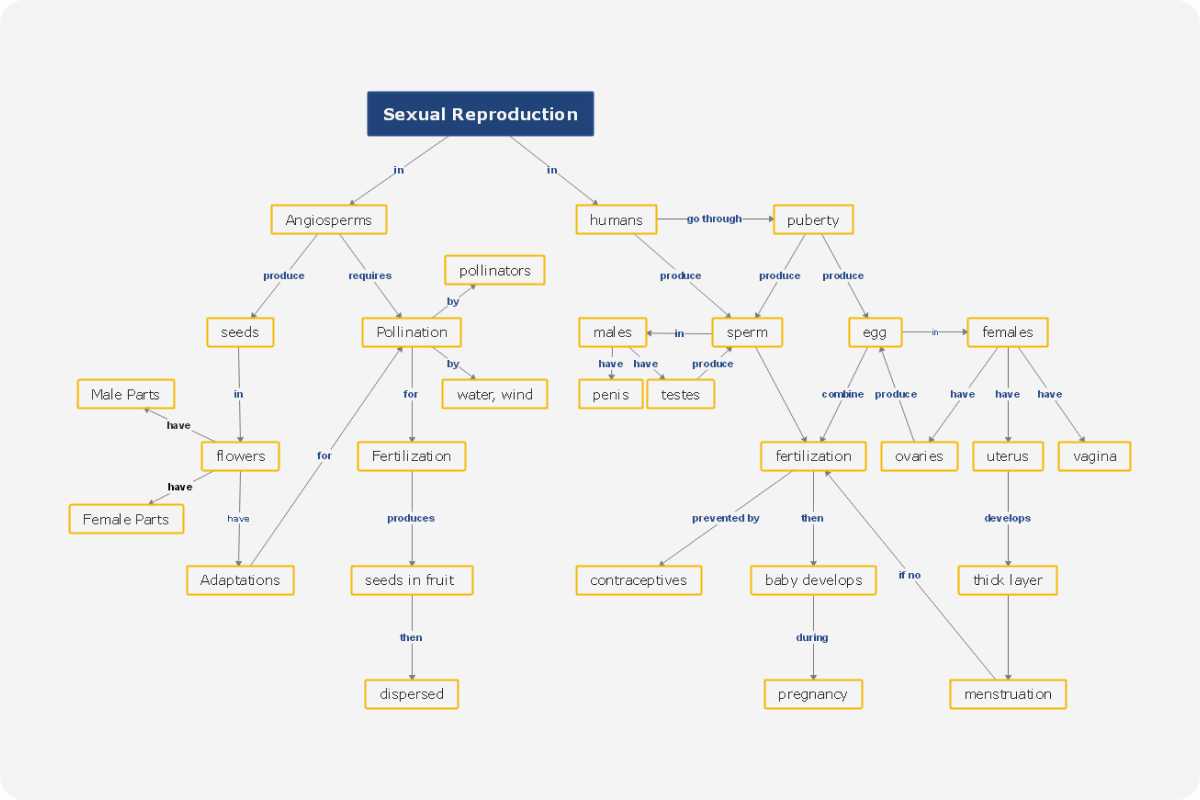
Example 2
This example below is another simplified concept used to ask quantitative questions on events, products, or ideologies to measure the respondents' implicative meaning. While the first example shows how to lay out gathered information into a concept map, this diagram below illustrates a straightforward method before collecting data.
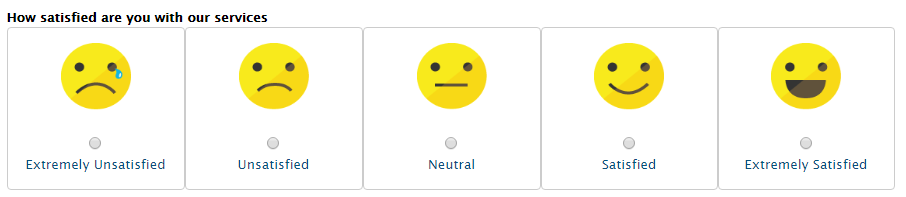
Source: www.questionpro.com
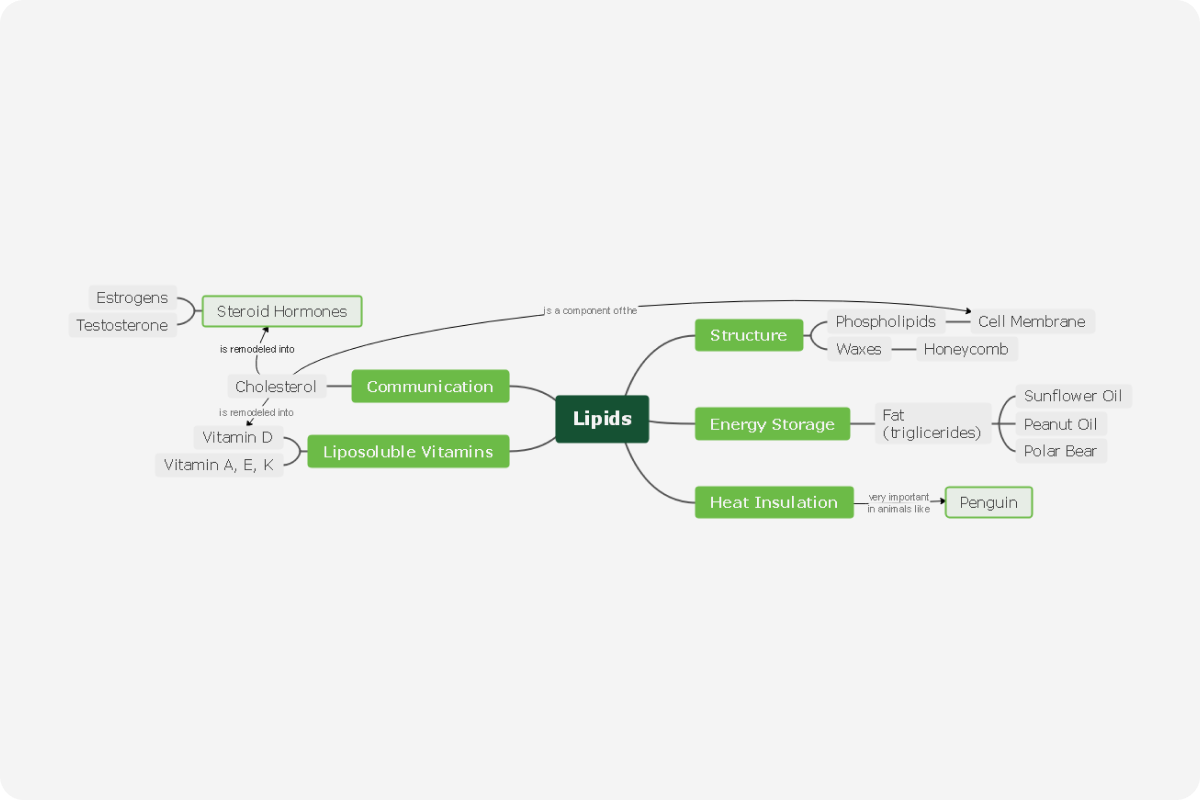
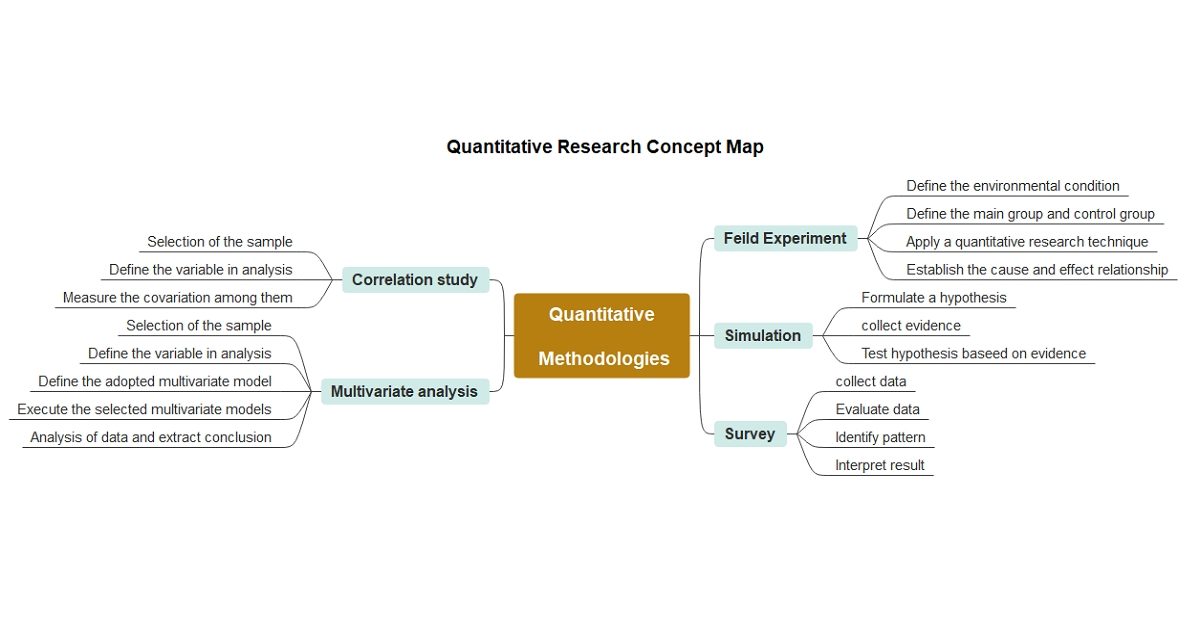
Example 3
Why EdrawMind?
EdrawMind is a full-featured collaborative mind mapping and brainstorming tool. It is convenient and helpful for you to use EdrawMind to sort out your thoughts, visualize ideas, take notes, plan projects and more importantly, find solutions to problems.
Users are allowed to insert different kinds of objects into topics and mind maps in EdrawMind, including relationship line, boundary, callout, summary, mark, clip art, picture, hyperlink, attachment, note, comment, and tag. EdrawMind offers you a simple way to create mind maps on Windows, macOS, and Linux. Download the desktop version and try the free online version now!
12 structures & 33 themes & 700+
cliparts
Support Win, Mac, Linux, Android, iOS
Advanced import & export options
On-premises software for business
Enterprise-level data security
12 structures & 33 themes & 700+
cliparts
Access diagrams anywhere, anytime
Templates Gallery
Team management & Project management
Real-time Collaboration